Running Rakazo on Kubernetes: From an Inventory CSV to a Verified Report, with a Grok Bot Comparison
Give a bot a three-row inventory file, tell it the filename, and ask it to leave behind a report. What can the recipient actually verify? In this experiment we could check the batch and total in chat, open the report on the bot’s desktop, and retrieve the file from its Kubernetes Pod for a byte-by-byte comparison with the application download. The three counts were 20, 19, and 16. They added up to 55, and the two copies of the report matched.
Rakazo is an open-source agent workspace you can host yourself. Each bot has a chat interface and access to a computer with a browser, terminal, and filesystem. Grok Bot offers a similar way to work. The differences show up when you ask who owns the computer, which other bots can read the file, and who investigates a broken desktop. We ran the task on Rakazo and used the official documentation for the Grok Bot comparison. Rakazo project · Grok Bot cloud computer
1. Where a request goes
A user submits a task in the web app. The API handles the conversation and access to the computer, the worker advances background jobs, and PostgreSQL stores application state and queued work. With the Kubernetes provider, the API and worker use the Kubernetes API to manage computer Pods in a separate namespace. The browser and report live on the computer. Model calls go to an OpenAI-compatible endpoint. This gives operators three paths to check independently: application to model, application to Kubernetes API, and application to desktop. Kubernetes deployment guide
| Component | What we ran |
|---|---|
| Versions | Kubernetes v1.30.4. Both the application and computer images corresponded to source revision 235018325032825a5e12f856c4ac0481c168aa5d |
| Control plane | One replica each of the web app, API, worker, and PostgreSQL 18.6. The application and database used persistent volumes |
| Execution | One bot with a private computer. Its Pod had limits of 2 CPUs and 4 GiB of memory |
| Model and access | DeepSeek-V4.1-Flash through a dedicated relay, with no GPU required in the cluster. The browser used a local port-forward. Public registration was closed |
The controller’s Role is scoped to the sandbox namespace. It can create, get, and delete Pods and open exec sessions. The computer Pod disables automatic ServiceAccount token mounting, drops Linux capabilities, and uses the RuntimeDefault seccomp profile. This lets an operator inspect the file through Kubernetes without giving the bot those cluster permissions. Upstream manifests
2. From deployment to the bot’s desktop
The Kubernetes manifests we consulted were at 7e851b0e58f4aa55b1f108035028969ca711c861. The upstream example targets K3s 1.35 or later. Running on v1.30.4 involved changes to network policy, computer placement, and the readiness probe, discussed in section 4. To reproduce the setup, follow the guide at that revision to choose storage, namespaces, and admission policies and to generate the application configuration and separate database, authentication, and encryption secrets. For a port-forward, set the authentication, web, and API origins to the address you will open in the browser. Deployment preparation · Example directory
These are the settings that mattered to the experiment. Use the same served model ID in both model fields. Both the API and worker need a route to the model endpoint and read RAKAZO_LOCAL_MODELS_API_KEY from a Secret. Since we reached the model through a relay, model calls also depended on that machine staying online. Self-hosted model settings
SANDBOX_PROVIDER=kubernetes
KUBERNETES_SANDBOX_NAMESPACE=rakazo-sandboxes
KUBERNETES_SANDBOX_CPU_LIMIT=2
KUBERNETES_SANDBOX_MEMORY_LIMIT=4Gi
PI_DEFAULT_PROVIDER=local
PI_DEFAULT_CREDENTIALS=host
PI_DEFAULT_MODEL=your-served-model
RAKAZO_LOCAL_MODELS=your-served-model
RAKAZO_LOCAL_MODELS_URL=https://llm.example.org/v1
Run the phases from the configured example directory. The commands use the upstream namespace names and leave the port-forward in the foreground. Wait for PostgreSQL before migrating, then start the application and bootstrap the first account.
kubectl apply -k . -l rakazo.example/phase=foundation
kubectl -n rakazo rollout status deployment/rakazo-postgres --timeout=300s
kubectl apply -k . -l rakazo.example/phase=migrate
kubectl -n rakazo wait --for=condition=complete job/rakazo-migrate --timeout=300s
kubectl apply -k . -l rakazo.example/phase=app
for component in api worker web; do
  kubectl -n rakazo rollout status "deployment/rakazo-$component" --timeout=300s
done
kubectl apply -k . -l rakazo.example/phase=bootstrap
kubectl -n rakazo wait --for=condition=complete job/rakazo-bootstrap --timeout=300s
kubectl -n rakazo port-forward --address 127.0.0.1 svc/rakazo-web 5173:5173
Sign in, create a bot with a private computer, and open the computer from the top of the chat. You can watch its desktop, take control to upload a file, and then release it back to the bot. Using a Rakazo computer
Figure 1. The signed-in bot’s computer. Rakazo supplies the top toolbar and Chromium runs inside the sandbox. Opening this view exercises the path from the web app through the API to the computer Pod.
3. Testing with a CSV whose answer was withheld
We generated a batch ID and three synthetic inventory rows, uploaded the CSV to the computer’s home directory, and released control. The chat request supplied the filename and asked the bot to check each row, calculate the total, write the batch and item counts to inventory-report.txt, and return the batch and total in chat. Only the CSV contained the batch ID and counts. The screenshots show the actual desktop with the environment prefix in the source filename masked.
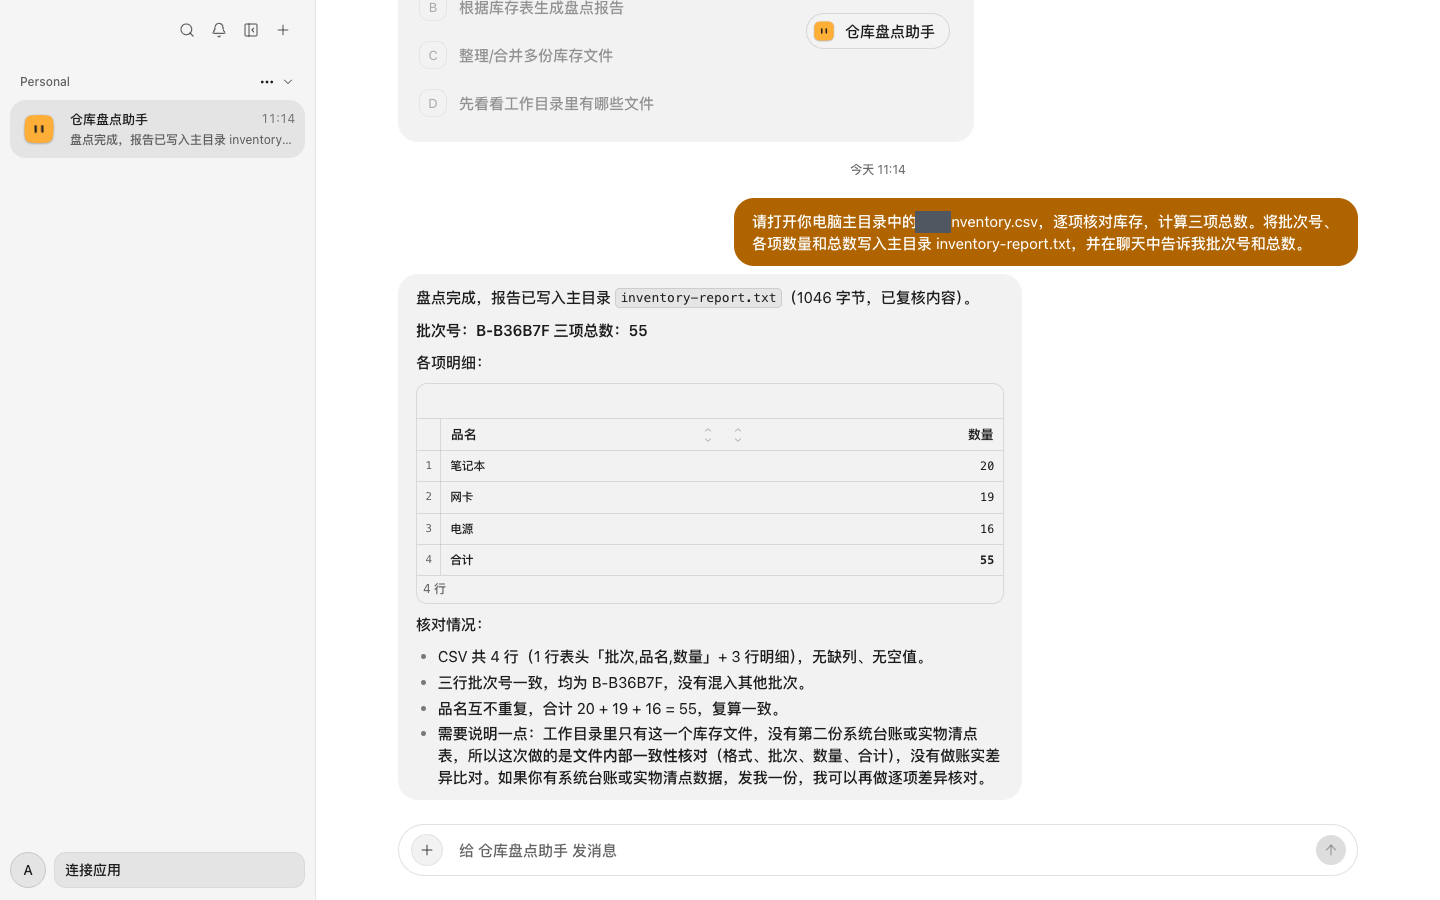
Figure 2. The reply gives batch B-B36B7F, with 20 laptops, 19 network adapters, and 16 power supplies, totaling 55. The bot also qualified its finding: it could check duplicates and arithmetic inside the one file it received. Reconciliation against physical stock would require a separate ledger or count sheet.
The recorded tools ran in this order: List files → Read file → Shell → Write file → Shell. To check the write, we opened /home/rakazo/inventory-report.txt in Chromium on the bot’s desktop. The report identifies the source file and batch, lists the counts, and explains which checks it could perform.
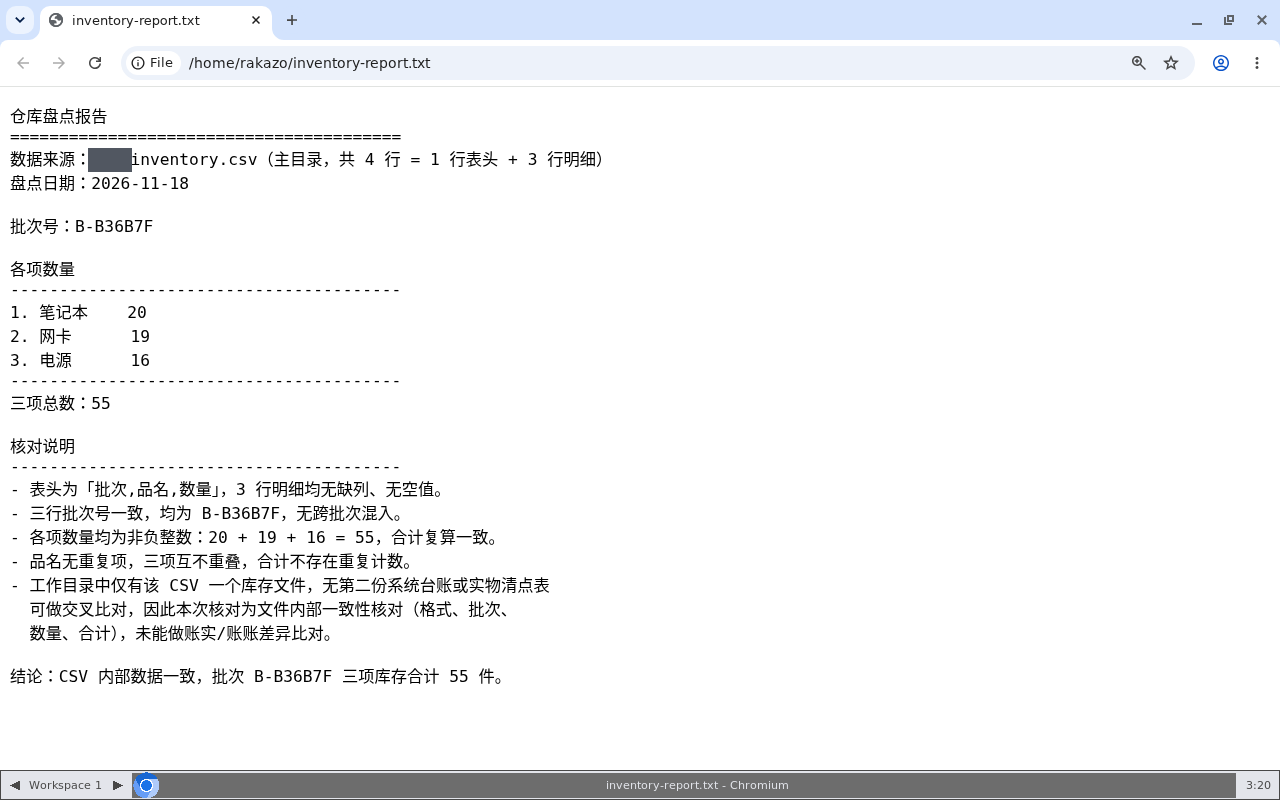
Figure 3. The address bar shows a local path inside the sandbox. The 55 items reported in chat can be checked against the three lines in the report and the original CSV saved before upload.
Finally, we downloaded the report using Rakazo’s computer/downloadFile and retrieved an independent copy from the running Pod. The commands below assume a single computer Pod, as in this test. Save the application download in the current directory first.
pod=$(kubectl -n rakazo-sandboxes get pods \
  -l app.kubernetes.io/name=rakazo-computer \
  -o jsonpath='{.items[0].metadata.name}')
kubectl -n rakazo-sandboxes exec "$pod" -- cat /home/rakazo/inventory-report.txt > report-from-pod.txt &&
  cmp inventory-report.txt report-from-pod.txt &&
  wc -c inventory-report.txt
cmp exited with status 0. The file was 1,046 bytes. The original CSV verified the numbers, while the independent reads verified that the bot had written a file and that the application delivered those same bytes. Recovery after Pod replacement, concurrent execution, and unattended long-running tasks would require separate tests.
4. Three symptoms with different causes
| Symptom | Evidence | What worked here |
|---|---|---|
| Sign-in worked, but starting a computer did not produce a desktop | Hubble showed denied controller traffic to the Kubernetes API, with the destination identity kube-apiserver |
Allowed API and worker egress to that identity on the actual API port, TCP 6443 here. The computer Pod did not need that control-plane route |
| The computer Pod ran but never became ready | A request inside the container to http://127.0.0.1:6080/ returned 200, while the kubelet’s TCP probe to the Pod address timed out |
Changed the generated computer template to probe HTTP inside the container and placed the computer on the same node as the application. We separately verified a 200 from the API to the desktop, then opened the real UI. Cross-node access remains untested |
| The sign-in page loaded, but submitting it returned Too many requests | Test and screenshot scripts repeatedly signed in and reached the limit of 10 attempts in 15 minutes | The scripts reused an authenticated session. For a manual sign-in returning 429, stop retrying and let the window expire |
An in-container probe establishes that the desktop process is listening. For a multi-node rollout, test desktop access to each computer Pod from the API’s location, then exercise the interactive session from a browser. Those checks distinguish a desktop process failure, a cluster network problem, and a user session issue.
5. Where would Grok Bot process the same file?
The Rakazo results below come from the experiment. Its Team and Private sharing rules come from the project’s documentation. The Grok Bot column describes the documented personal cloud computer and file-delivery behavior. We did not run the inventory task on Grok Bot. Rakazo computers and sharing · Grok Bot computers and apps · Grok Bot files and results
| Question | Rakazo | Grok Bot |
|---|---|---|
| Where does the input go, and how do I get the report? | We uploaded to the private computer Pod’s home directory. The user could retrieve the report through the app and a cluster operator could verify the Pod copy independently | Work runs on the account’s persistent cloud computer. Users can retrieve delivered files in chat or return to the computer to continue working |
| Can a second bot read the same file? | In the default Team mode, bots in a space share files and installed tools. Private gives one bot its own computer, as in this run | Bots on the same account share files, browser sign-ins, and command-line credentials. Each has a separate screen on the same computer |
| Can I close my laptop during the count? | The worker and computer ran in the cluster. This test also depended on a model relay. Losing it would affect subsequent steps requiring the model | Ordinary cloud work continues with the laptop closed. A task that uses a local resource depends on the connection to that resource |
| Who investigates an unavailable desktop? | The platform team can inspect the controller, Pods, probes, and network policies. It also operates those components, storage, and the model endpoint | The provider operates the cloud computer. Users can inspect or take over the screen, check app connections, and review delivered files |
Self-hosting let us choose the cluster that stored the inventory file, select the inference endpoint, and retrieve the output independently. Model requests can carry content read from the file, so the location of the inference endpoint also matters for data residency. If colleagues mainly need to hand off a file, close their laptops, and retrieve the result later, Grok Bot’s managed computer reduces the infrastructure the team operates. Two questions to ask before adopting either: should a second bot be able to read the first one’s input, and who can recover and verify the final report once the desktop is gone? Related article on Grok Bot cloud computers and enterprise governance