Large-Scale Kubernetes Monitoring Solutions: How to Choose Between Prometheus, VictoriaMetrics, Thanos, and Mimir
For monitoring hundreds of Kubernetes clusters or tens of thousands of nodes, the real difficulty is usually not "whether there are curves," but that monitoring itself becomes a large production system: scrapers connect to the API Server, metrics enter storage, queries span multiple clusters, and alerting depends on this entire chain.
When discussing Prometheus and VictoriaMetrics, the scope of comparison must first be clarified. Prometheus handles scraping, local storage, querying, and rule evaluation simultaneously; VictoriaMetrics can serve purely as a remote time-series storage, or be combined with components such as vmagent and vmalert to form a complete monitoring system. The two can coexist; there is no need to do a full replacement from the start.
My selection order is: first calculate series and sample scale, then decide the responsibilities of local versus central components, then compare storage and query costs, and finally validate failure recovery. Node count is only an entry point; it cannot directly imply "beyond N nodes you must switch databases."
1. Break Monitoring into Six Layers
| Layer | Common Components | Questions to Answer at Scale |
|---|---|---|
| Metric sources | kubelet, cAdvisor, node-exporter, kube-state-metrics, control plane, business instrumentation | Whether scraping is duplicated, whether labels grow without bound |
| Service discovery and scraping | Prometheus, Prometheus Agent, vmagent, Grafana Alloy | How much pressure LIST/WATCH places on the API Server |
| Write and buffering | Remote Write, WAL, scraper disk queues | How long data can survive while the central side is unavailable |
| Time-series storage | Prometheus TSDB, VictoriaMetrics, Thanos/Mimir storage chain | Retention, replication, backup, scaling, and disk failures |
| Query and rules | PromQL/MetricsQL, query frontend, Ruler, vmalert | Whether queries crowd out alerting, how cross-cluster rules execute |
| Alerting and visualization | Alertmanager, Grafana, on-call systems | Whether effective alerts can still be seen and received during failures |
TSDB is Time Series Database; WAL is Write-Ahead Log; Remote Write is the interface that sends scraped samples to a remote storage backend. They respectively address storage, crash recovery, and data transfer, and cannot substitute for one another.
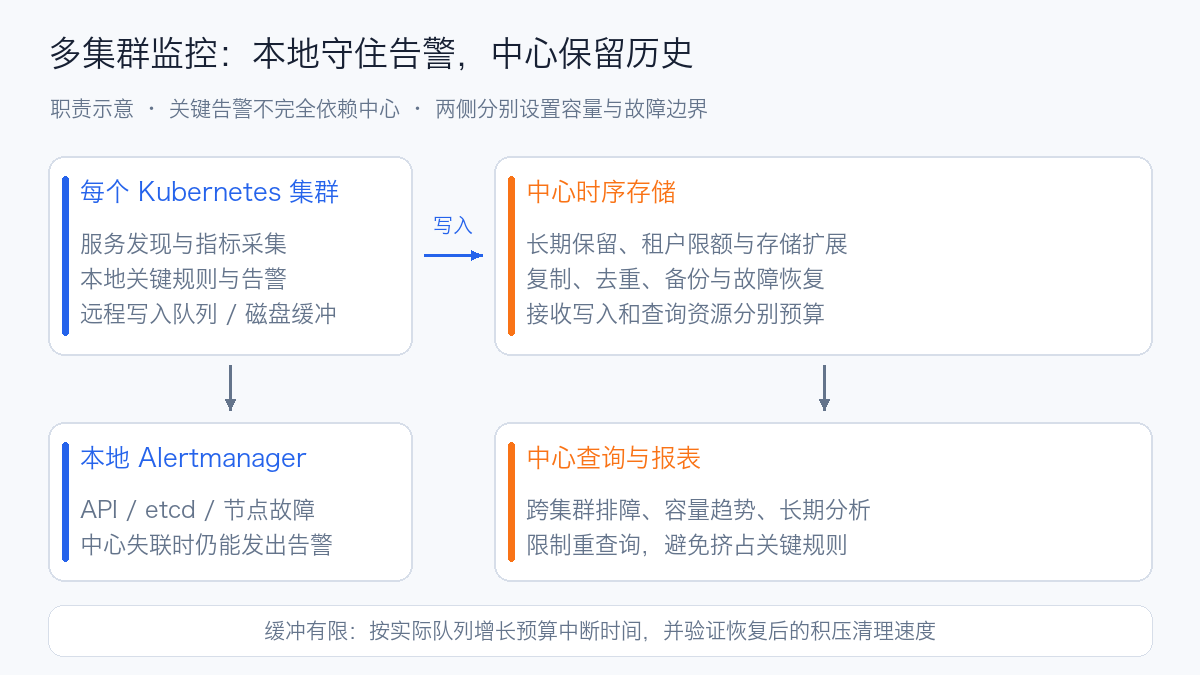
For a multi-cluster platform, I prefer to keep critical alerts local to each cluster, with the central side responsible for long-term data, cross-cluster analysis, and capacity reports. This way, if the central network or database fails, you do not simultaneously lose API Server, etcd, and node failure alerts for all clusters.
Deploying only Agents and placing all rules centrally is also possible, but "alerts unavailable after central failure" must be counted as an architectural trade-off. Agents do not have the full local query and rule capabilities of a Prometheus Server. Prometheus Agent Mode
2. Capacity Model: Look at Series, Samples, and Rate of Change
Each combination of a metric name and its full label set constitutes one time series. For large-scale monitoring, I calculate at least six numbers:
| Data | Purpose |
|---|---|
| Active series count | Estimate memory, index, and cache pressure |
| New series created per second | Identify churn caused by short-lived Pods and high-cardinality labels |
| Samples written per second | Estimate network, write, and compression throughput |
| Single scrape response size | Identify large exporters, timeouts, and response limits |
| Series and time range touched by queries | Evaluate query fan-out and resource isolation |
| Number of rules and per-evaluation cost | Determine whether rules can complete on time |
Churn refers to the continuous creation and disappearance of series. Two systems can both have 10 million active series; if one is produced by long-lived stable nodes and the other constantly creates short jobs and new Pods, the index and cache costs can differ greatly.
Below is a set of hypothetical inputs used to understand orders of magnitude, not local benchmark results:
English rendering — the original text is retained below.
"Equivalent series per node" already accounts for nodes, containers, objects, and business metrics; these categories must not be added again on top of it. The capacity budget should derive this value from real samples measured in practice, not by copying 5000 directly.
The Prometheus documentation gives a rough reference of approximately 1–2 bytes per sample for compressed storage. Continuing with this set of assumptions, compressed sample volume alone is approximately 144–288 GB/day, and about 4.32–8.64 TB for 30 days, using decimal units. This estimate does not replace measuring index, WAL, Head, replication, and query temporary space. Prometheus storage capacity estimation
Classic histograms additionally produce multiple _bucket, _sum, and _count series. If 10 buckets, 20 routes, 5 methods, and 4 status code classes are retained, one instance can theoretically combine to 12 × 20 × 5 × 4 = 4800 series; in practice, only combinations that actually occurred are counted. After putting user IDs, request IDs, or full URLs into labels, series can expand rapidly even when node count stays unchanged. Prometheus metric design
3. Four Main Routes in One Table
| Route | Main Advantages | Scaling Approach | Costs to Bear |
|---|---|---|---|
| Local Prometheus + kube-prometheus-stack | Mature Kubernetes rules and community ecosystem; scraping, querying, and alerting work directly | Shard by responsibility/target, with independent replicas per shard | Local TSDB does not form a shared storage cluster; cross-shard queries and rules need additional solutions |
| Prometheus + Thanos | Keeps Prometheus, adds unified query and object-storage long-term retention | Query, Store Gateway, Compactor, Ruler, etc. deployed by responsibility | Component and object-storage governance; recent data still depends on the online scrape/ingest chain |
| Prometheus/Agent/vmagent + VictoriaMetrics | Scraping and storage decoupled; can start from a single node; storage cluster splits write, store, and query | VMSingle, or the vminsert/vmstorage/vmselect cluster | Replication, deduplication, label governance, query semantics, and failure domains need explicit configuration |
| Prometheus/Alloy + Grafana Mimir | Complete multi-tenancy, quotas, centralized storage, and query governance capabilities | Distributed components, object storage; new architectures can introduce Kafka | Heavy operational dependencies; version and deployment architecture affect the failure model |
This table compares system shapes; it does not claim that any product is naturally ten times faster or uses only one tenth of the memory. Such conclusions must be measured with the same series, labels, scrape interval, retention period, replication factor, and query load.
3.1 Prometheus: Single-Node Storage Does Not Mean It Can Only Monitor Small Clusters
Prometheus can expand scrape coverage through functional sharding and target sharding. Prometheus Operator supports sharding by target, with replicas for high availability; adding replicas does not split the load of a single instance evenly. Cross-shard queries and rules are typically aggregated by Thanos or similar. Prometheus Operator high availability and sharding
I would first try separating control plane, nodes, Kubernetes objects, and business metrics. Different categories have different scrape intervals, label budgets, and alert importance; sharding by responsibility is easier to understand and troubleshoot. If a single target itself is very large, merely increasing the target shard count cannot automatically split that response into several pieces.
Prometheus local TSDB does not provide cross-node replication. Two identically configured Prometheus instances are two independent datasets, and scrape timestamps may also differ; unified queries require deduplication. Do not let multiple replicas share the same data directory. Prometheus local storage
3.2 Thanos: Keep Prometheus, Extend Long-Term Querying
Thanos Sidecar can serve recent data queries and upload blocks generated by Prometheus to object storage. Query aggregates multiple sources, Store Gateway reads historical blocks, Compactor performs compaction and other maintenance, and Ruler provides rule evaluation. Thanos Sidecar, Thanos Query, Thanos Compactor
Its important boundary is: historical blocks already in object storage do not mean the latest data has also been safely uploaded. In Sidecar mode, upload depends on block generation and upload progress; failure validation must cover loss of contact with recent data sources, Store Gateway latency, and Compactor backlog.
Teams that already have a large number of Prometheus rules and local alerts and want to gradually unify historical queries are usually a good fit to evaluate this route first. Using Thanos Receive to accept remote writes is a different topology and cannot reuse all of Sidecar's capacity and recovery assumptions.
3.3 VictoriaMetrics: Distinguish Single-Node from Cluster
VMSingle provides time-series storage and querying in one service, suitable for getting started and for isolated units. The cluster edition splits into:
vminsert: receives writes and routes series to storage nodes;vmstorage: stores samples and maintains indexes;vmselect: executes queries, reads from storage nodes, and merges data.
After splitting, each part can be scaled independently, but "multiple vmstorage" does not by default mean every sample already has multiple replicas. Replication factor, rerouting during failures, and partial query results all need separate validation. VictoriaMetrics cluster architecture
vmagent handles discovery, scraping, filtering, and remote writes, and can be configured with disk buffering; vmalert evaluates rules and hands alerts to Alertmanager. Do not assume the entire chain is accepted just because storage deployment succeeded. vmagent, vmalert
VictoriaMetrics uses MetricsQL, which supports most PromQL usage, but has semantic differences for rate, increase, implicit windows, and others. A dashboard showing numbers only proves the query ran; migration should also compare key queries and alert boundaries over fixed time ranges. Differences between MetricsQL and PromQL
3.4 Mimir: Evaluate Multi-Tenancy Capabilities Together with Architecture Dependencies
Mimir suits centralized multi-tenant scenarios: it can set limits on tenant writes, series, and queries, and retain historical data through object storage. It also supports different architectures, and not all versions should be described as the same chain.
The official recommendation is the ingest storage architecture, stable since Mimir 3.0: writes are persisted through Kafka, and Ingesters asynchronously consume and produce queryable data and storage blocks. Write and read paths are decoupled, but this introduces Kafka capacity, replication, and consumption-latency governance; write acknowledgment and immediate query visibility are not the same thing. Mimir ingest storage architecture
Existing classic architectures must be evaluated according to their Distributor/Ingester, WAL, and replication models. When adopting, record the actual version, deployment mode, and data path, rather than just writing "Mimir high availability." Mimir Ingester
4. The Bottleneck Encountered Before the Database: Service Discovery
Monitoring is not a bystander. Every discovery client may LIST/WATCH Pod, Node, EndpointSlice, and other resources, receiving objects, deserializing them, and maintaining caches. When many scrapers restart at once, the resulting control-plane pressure can be more pronounced than steady-state writes.
In particular, three kinds of filtering must be distinguished:
| Filter Location | What It Can Reduce | What It Cannot Automatically Reduce |
|---|---|---|
| Kubernetes service discovery namespace / label / field selectors | API-returned objects and Watch scope, depending on discovery role and configuration | Other independent Watches already created |
| Target relabeling | Actual scrape targets | Discovery objects already received before filtering |
| Metric relabeling | Series and samples stored | The cost already paid for scraping the response and parsing it |
Therefore, "keeping only ten targets" does not necessarily mean only ten objects are discovered. When configuring, check the generated kubernetes_sd_configs, and do not just look at the surface count of ServiceMonitors. Prometheus Kubernetes SD configuration
kube-state-metrics must also be accounted for separately. It reads object state and generates metrics; horizontal sharding does not guarantee that API Server discovery pressure drops proportionally: the official documentation states that sharded instances still need to watch all relevant objects, then assign processing by shard. Scope can be controlled by combining namespace partitioning, resource allowlists, and label allowlists. kube-state-metrics sharding
For a multi-cluster central setup, I prefer local discovery and local scraping, with the central side receiving Remote Write. Having the central side directly Watch all production clusters is not infeasible, but it requires holding credentials for more clusters while also bearing cross-datacenter discovery and reconnection storms.
5. Series Governance and Query Isolation
My label conventions keep stable dimensions such as cluster, environment, region, and tenant, and prohibit using request IDs, user IDs, random sessions, and full dynamic URLs directly as metric labels. Lifecycle dimensions such as Pod name and UID are kept as needed for diagnostics, with an explicit budget assigned.
Governance is not complete just by removing UIDs: if the original design relied on them to distinguish different objects, removing them can create conflicts or out-of-order data on the same series. Cardinality reduction should come jointly from instrumentation, object semantics, and scrape configuration.
On the query side, load is divided into three categories:
| Type | Handling |
|---|---|
| Alerting and core SLOs | Fixed windows and aggregation dimensions, independent budget, guaranteed to evaluate on time |
| On-call troubleshooting | Restrict default cluster, time range, and query fan-out; allow gradual drill-down |
| Monthly capacity reports | Precompute or downsample, control concurrency, avoid competing with real-time alerting resources |
SLO is Service Level Objective. For a one-hour API error rate alert, you should not scan thirty days of raw series for every Pod in the company every 30 seconds.
Recording Rules are used to precompute common aggregations; streaming aggregation can reduce data volume before ingestion. The latter sacrifices raw detail, and data from the same aggregation group must be correctly aggregated together. Histogram buckets must first be aggregated with identical boundaries before computing quantiles; per-node P99 values cannot be summed or averaged. Prometheus recording rules, VictoriaMetrics streaming aggregation
6. High Availability, Deduplication, and Backup Are Three Separate Things
High Availability (HA) addresses whether service can continue after failures; deduplication addresses the query semantics of duplicate samples; backup addresses recovery after data is deleted, corrupted, or an entire failure domain is lost. Two replicas do not substitute for backup.
Dual collection replicas increase exporter, network, and storage costs. How replica labels are handled must also be made explicit: Thanos supports a configurable replica label for query-side deduplication; VictoriaMetrics deduplication requires samples to fall into the same series identity, with an appropriate deduplication window configured. If two collection replicas still carry different replica labels, they are different series, and simply adding a deduplication parameter cannot guarantee correct results. Thanos Query deduplication, VictoriaMetrics deduplication
The collector's local buffer is also not an unlimited data safe. The following needs to be measured:
English rendering — the original text is retained below.
Do not directly apply the database's post-compression "bytes/sample" figure to the send queue. Queue encoding, batch compression, labels, retries, and dual writes all change the actual size, and the formula above is only an upper bound for disk budgeting, also constrained by component version, WAL retention, and eviction policies. Recovery send capacity must exceed the new ingestion rate; otherwise, even after the central system recovers, the backlog will never drain. Prometheus Remote Write tuning, vmagent disk buffering
In failure reviews, define the Recovery Point Objective (RPO, how much data loss is acceptable) and the Recovery Time Objective (RTO, how quickly service must be restored). HTTP write acknowledgment, query visibility, disk persistence, and off-site backups are different stages; the boundaries must be confirmed using the chosen version's actual implementation and measured failure results.
7. Storage: Confirm Fault Domains First, Then Talk About Retention
The Prometheus documentation explicitly does not support NFS/EFS as the local TSDB filesystem and recommends a local filesystem. Do not mount a shared directory for all Prometheus instances just for replica convenience. Prometheus filesystem requirements
Production evaluation priorities include disk throughput, random reads, space during compaction, WAL replay, and recovery queries. SSD/NVMe often improves these paths, but the effect still depends on the index, query, and disk profile.
When using Local PersistentVolume, Pod recreation is usually still constrained to the original node. A PVC retaining data does not mean it can be immediately mounted on another node after the original node fails. The VictoriaMetrics storage cluster requires replication and node layout configured according to storage fault domains; Thanos/Mimir object storage also requires governance of its own capacity, permissions, lifecycle, and availability.
Retention should distinguish short-term troubleshooting from long-term reporting. Defaulting to keeping all container-level raw metrics for one year often exhausts the budget faster than changing the database. How long raw data is retained, how long aggregated data is retained, and who owns deletion responsibilities should all be part of the platform configuration.
8. Deployment Validation of a VictoriaMetrics K8s Stack
To verify the full chain, I deployed a standalone VictoriaMetrics K8s Stack on an experimental cluster running Kubernetes v1.30.4 with 12 nodes, while keeping the existing monitoring in place. What is validated here is integration and usability, not a fair Prometheus/VM performance comparison, nor a ten-thousand-node capacity test.
| Item | Validation Result |
|---|---|
| Helm Chart | victoria-metrics-k8s-stack 0.95.2 |
| VictoriaMetrics / Operator | v1.153.0 / v0.75.0 |
| Grafana | 13.2.3, experimental entry with anonymous read-only access |
| Storage | VMSingle, 14-day retention, 20 GiB PVC; Grafana 2 GiB PVC |
| Scrape interval | 30 seconds |
| Default dashboards | 44, including Kubernetes, control plane, etcd, and VM self-monitoring |
| Rules | 39 groups, 270 rules, no execution errors at acceptance time |
| Scrape targets | 75 targets, 71 healthy; the 4 failed targets all belong to the same pre-existing offline node |
| Coverage | API Server, etcd, scheduler, controller-manager, kubelet, CoreDNS, object and node metrics |
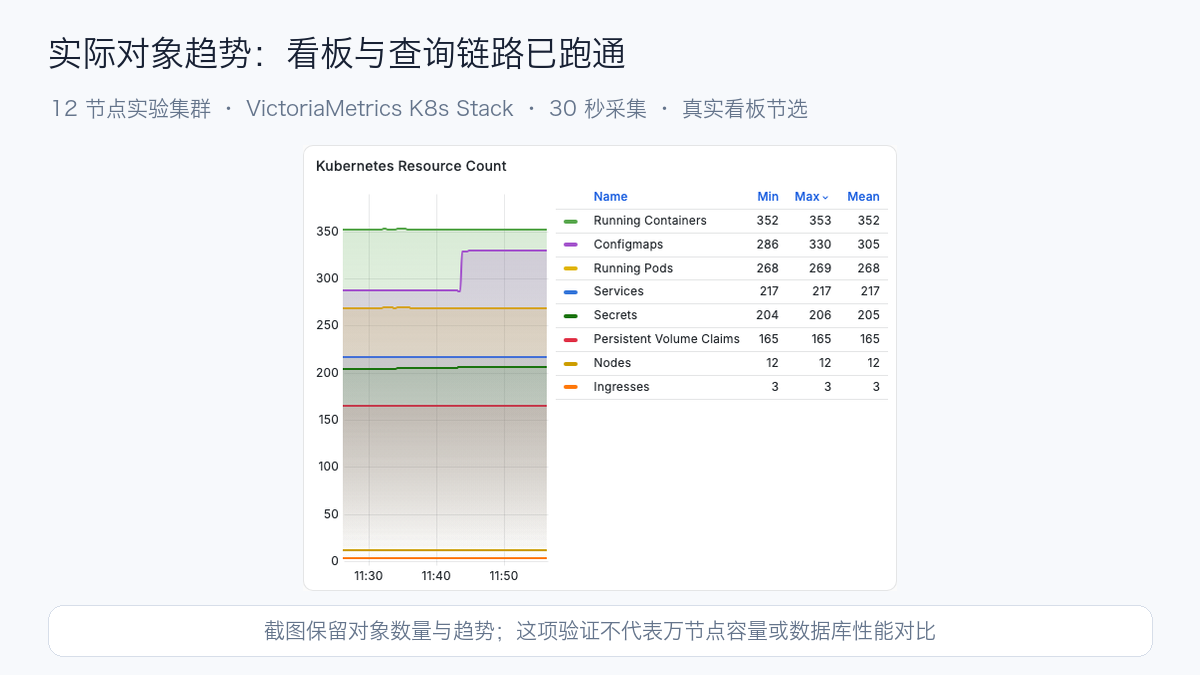
This deployment exposed three details worth validating:
First, dashboard import failure and database failure are two different classes of problems. The environment could reach some image registries, but the online sync job could not download raw files from GitHub. In the end, I downloaded the sources on a client with network access, used the official sync-job's local input and output modes to generate ConfigMaps and rules, and then imported them into the cluster. The large node-exporter dashboard exceeded the annotation size limit of client-side apply, so I switched to Server-Side Apply to complete the import.
Second, a scraping Pod being Running does not mean the discovery scope is correct. Initially, the namespace scope and permissions limited discovery to the monitoring namespace, and control plane targets were not correctly covered. After adjusting the standalone collector's discovery and RBAC (Role-Based Access Control), I verified targets, up, and representative queries one by one.
Third, metric responses also have size limits. The API Server's /metrics exceeded vmagent's default 16 MiB limit, so target discovery succeeded but scraping failed. After adjusting that target's max_scrape_size to 64 MiB according to the actual component configuration, collection resumed. In the long term, metric and label scale still needs governance; the limit cannot be raised indefinitely.
Finally, I actually opened the login-free Grafana dashboard to confirm that data sources, charts, and queries work. Default dashboards also need checks on denominators and coverage: the node sets of node-exporter, kube-state-metrics, and cAdvisor may differ, and the capacity of two nodes cannot be treated as the capacity of all twelve nodes. The screenshots in this article only show the verified object count panels.
The default Alertmanager receiver is not yet connected to a notification channel, so "rules executed successfully" does not mean alerts have been delivered. Production delivery also requires notification verification, permissions, backup recovery, and configuration update acceptance. VictoriaMetrics K8s Stack, official sync-job local generation method
9. Migrating from an Existing Prometheus: Validate with Dual Writes First
I prefer a phased migration to avoid changing the collector, labels, database, and alerting rules all at once:
- Keep the existing collection, alerting, and short-term storage, and add writes to the new backend.
- Confirm
cluster, tenant, instance, and replica labels, and clarify the deduplication semantics. - Compare both data sources over a fixed time range for error rate, throughput, CPU, histogram quantiles, and object counts.
- Validate counter resets, missing samples, staleness, native histograms, exemplars, and Remote Write protocol version compatibility; only test the capabilities you actually plan to use.
- Run failure tests for remote outages, full queues, process restarts, query overload, and backup recovery.
- Migrate reporting first, then critical rules; keep the original chain as a rollback window.
Staleness refers to the semantics of a series becoming invalid; an exemplar is a sample that associates a metric with a specific request/Trace. For teams that need these capabilities, verify the actual versions and data formats on both sides; do not interpret "Prometheus-compatible" as meaning every protocol detail is identical.
If you already manage production monitoring with kube-prometheus-stack, any new writes or collection should be incremental changes based on the current full production values, preserving existing GPU, control plane, etcd, and custom rules. Compare jobs, Secret references, and targets before and after the upgrade, rather than overwriting the entire release with a new minimal configuration.
10. How I Would Approach the Selection
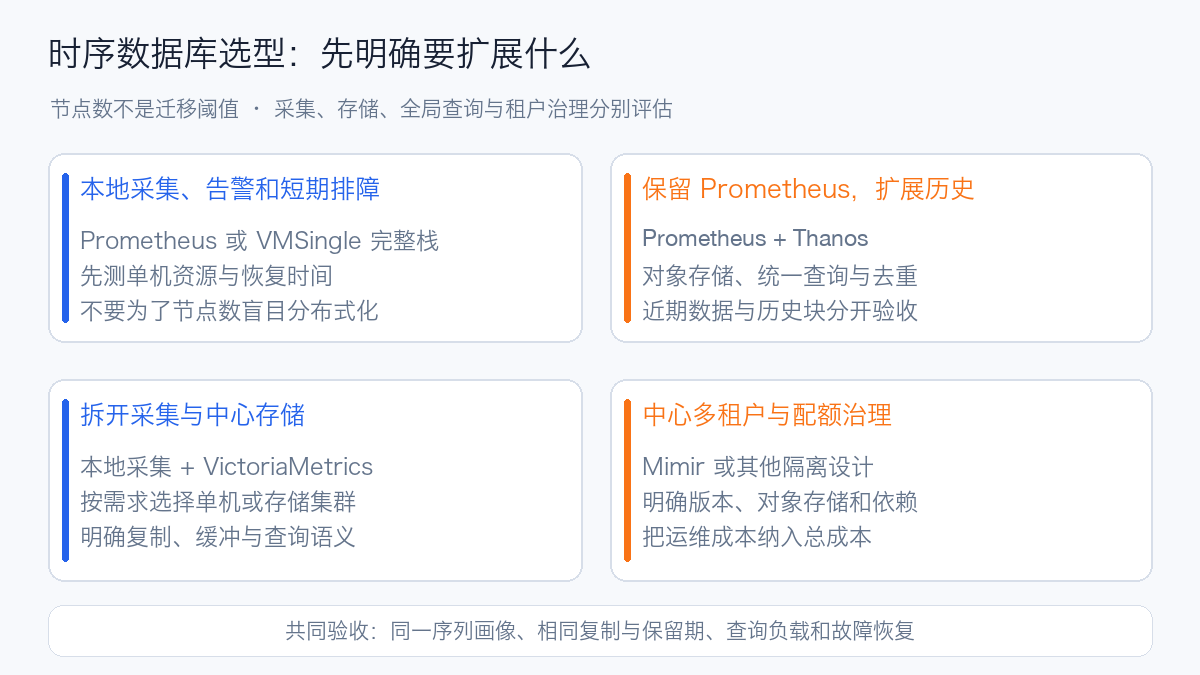
| Environment and primary requirements | Priority evaluation | Decision basis |
|---|---|---|
| Single cluster, manageable load, short-term alerting and troubleshooting | Local Prometheus or full VMSingle stack | Team familiarity, actual memory/disk, and recovery time |
| Many existing Prometheus instances, want unified long-term querying | Prometheus + Thanos | Rule reuse, object storage, and global query cost |
| Multi-cluster centralized writes, want gradually scalable storage | Local collection + VictoriaMetrics | Write, query, resource, replication, and maintenance cost under the same profile |
| Strong tenant isolation, central quotas, and complex query governance | Mimir or another centrally designed solution with isolation | Tenant limits, read/write architecture, object storage, and operational dependencies |
| Cluster autonomy, unreliable cross-datacenter links | Local critical rules + limited buffering + central long-term data | Whether alerting works during network isolation, data loss, and backlog drain time |
Choosing Prometheus usually means choosing a mature local collection and alerting ecosystem; choosing VictoriaMetrics is often about rebalancing the division of labor between storage and collection, and using measured cost to decide between single-node and cluster mode. Thanos and Mimir respectively offer paths that preserve the Prometheus ecosystem and central distributed governance.
Final acceptance cannot look at compression ratio alone. What I want is: queries and rules complete on time under normal conditions, the cluster can still alert during a central failure, the backlog drains after recovery, storage loss can be recovered per the agreement, and the system does not end up overwhelming the Kubernetes API Server in order to monitor Kubernetes.