Observability and Resource Accounting
Kubernetes container metrics cannot cover the full cost of Kata/Firecracker sandboxes. Capacity decisions need to align at least the following three layers of data:
English rendering — the original text is retained below.
Single-Point Sampling Results
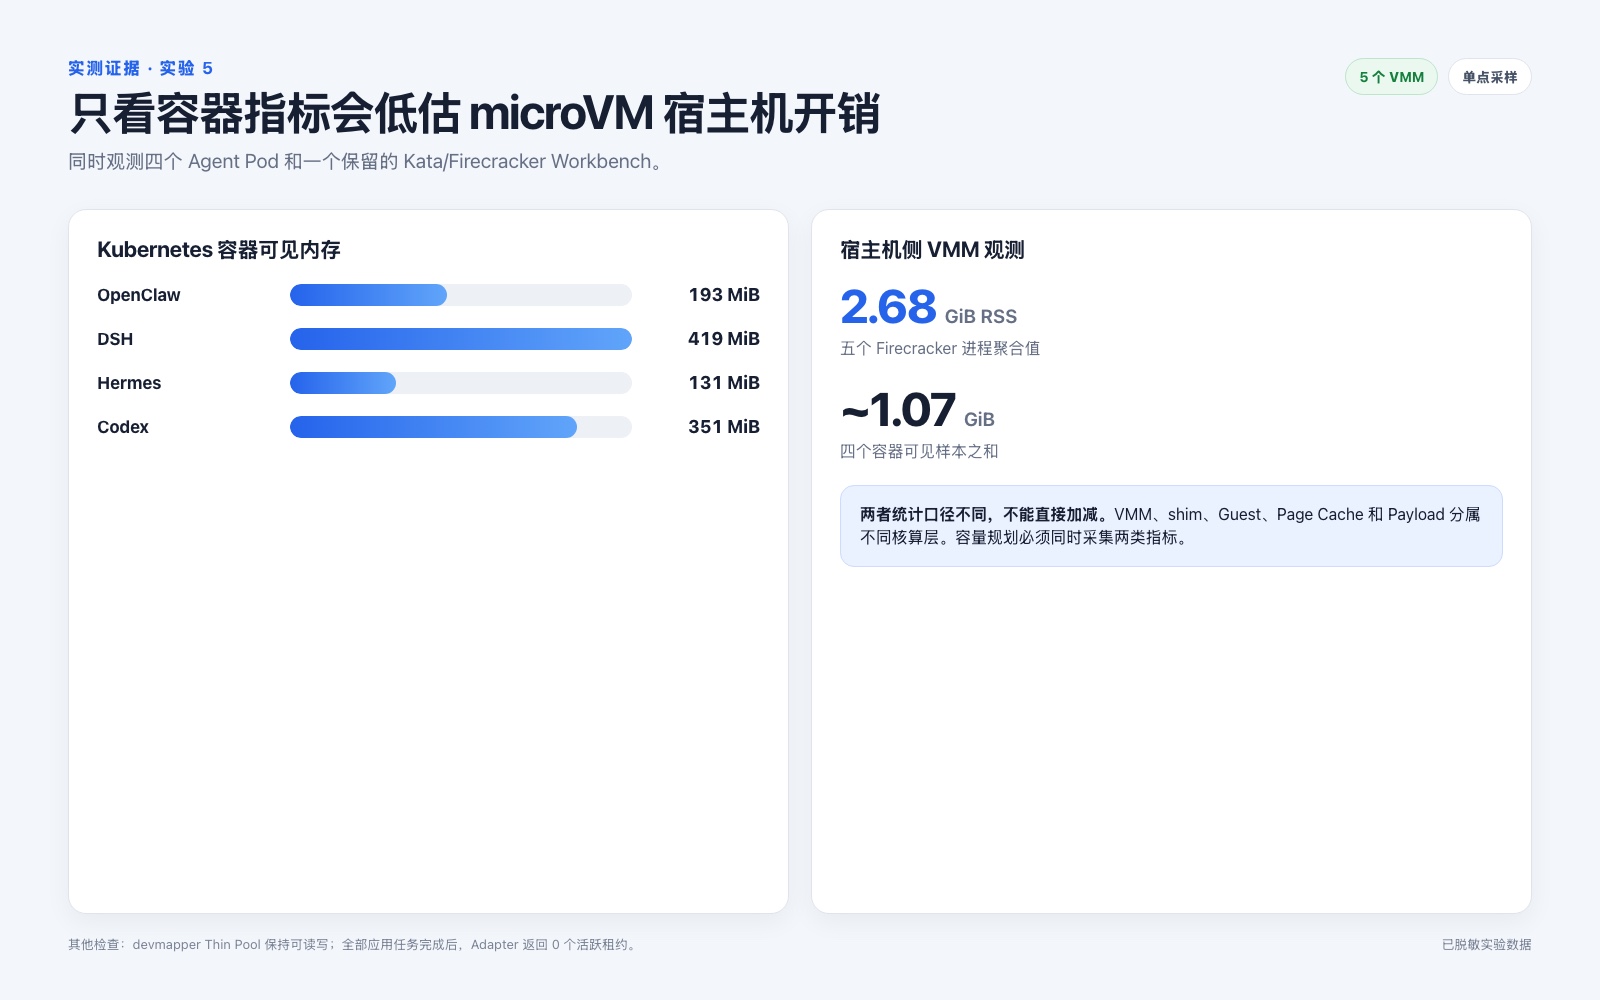
At sampling time, four Agent Pods and one reserved Workbench were running.
| Signal | Observed result |
|---|---|
Business container memory in kubectl top |
OpenClaw 193 MiB, DSH 419 MiB, Hermes 131 MiB, Codex 351 MiB |
| Business container subtotal | 1,094 MiB, approximately 1.07 GiB |
| Host VMM count | 5 Firecracker processes |
| Total VMM RSS | 2,812,964 KiB, approximately 2.68 GiB |
| Host memory at sampling | Used 12,128 MiB, available 227,135 MiB |
| Host average load | 1.75 / 1.07 / 1.05 |
| Devmapper | Pool writable, low utilization |
| Adapter lifecycle | cube_adapter_active_leases is 0 after task completion |
These are only smoke observations at a point in time, not capacity benchmarks. The key finding is an accounting gap: merely summing the readings of the four business containers misses the Firecracker VMM working set and other host-side runtime costs.
Collection Checklist
Use timestamps or run IDs to correlate the following data sources:
kubectl top pod -n agent-runtime
kubectl get pod -n agent-runtime -o wide

# 在专用 Worker 上执行:
ps -eo pid,ppid,rss,etimes,args | grep '[f]irecracker'
dmsetup status fc-devpool
ctr -n k8s.io snapshots --snapshotter devmapper ls
Also retain:
- Kata shim CPU/RSS and its cgroup path;
- VMM CPU/RSS and thread count;
- CNI/TAP counters and packet loss;
- devmapper data and metadata utilization;
- Firecracker API, block device, network, latency, and seccomp metrics;
- Adapter request latency, error count, active leases, and release results.
Firecracker metrics need to be configured before startup and do not automatically recover with snapshot state. The recovery process must first recreate the metrics and logger endpoints, then load the snapshot.