OpenTelemetry in Kubernetes: From OTLP to Prometheus, Langfuse, and Log Pipelines
Kubernetes already has Prometheus, Grafana, Loki, Elasticsearch, Tempo, Jaeger, and various APMs. Why introduce OpenTelemetry?
The reason is not to add another monitoring backend, but to separate three concerns from specific vendors: how applications generate telemetry, how telemetry is transmitted, and how the platform processes it uniformly. Applications uniformly send OTLP; the platform enriches Kubernetes metadata in the Collector, cleans sensitive fields, controls cardinality, sampling, and routing; backends continue to handle the storage and query they are best at.
This article first explains where OpenTelemetry fits in Kubernetes, then uses a reproducible experiment to run through the following pipeline:
English rendering — the original text is retained below.
This run executed 20 normal requests, 1 slow request, and 1 expected error request. The final results: 22 business Traces and 87 valid Spans found in Langfuse, three request counters in Prometheus at 20 / 1 / 1, and the Collector's ServiceMonitor Target Up. Traces generated by health probes were excluded from the pipeline. This traffic is used to verify telemetry completeness, not as an application performance benchmark.
Full code and Kubernetes manifests are available at examples/opentelemetry-kubernetes-practice; redacted result data is available at results.json.
1. What Problem OpenTelemetry Solves
OpenTelemetry provides four layers of capability:
| Layer | Role | Corresponding content in this article |
|---|---|---|
| API and SDK | Create Spans, Metrics, and Logs in applications, and propagate context | Python SDK, FastAPI automatic instrumentation, and three business Spans |
| Semantic Conventions | Define field semantics for service.name, HTTP, database, GenAI, etc. |
Unified service and Kubernetes resource attributes |
| OTLP | Transmit Trace, Metric, and Log over a unified protocol | Applications send to Collector via OTLP/HTTP |
| Collector | Receive, process, filter, sample, batch, and export | Gateway Deployment routes to Langfuse and Prometheus |
It does not replace all backends:
- Prometheus still handles metric time series, PromQL, and alerting;
- Grafana still handles dashboards;
- Tempo, Jaeger, or APMs handle general-purpose distributed tracing;
- Loki, Elasticsearch, etc. handle log storage and retrieval;
- Langfuse handles LLM/Agent Trace, Token, cost, Prompt, and evaluation semantics.
Applications face only one telemetry standard; backend selection and migration are handled by the platform side. This is the most direct value OpenTelemetry brings to a Kubernetes platform.
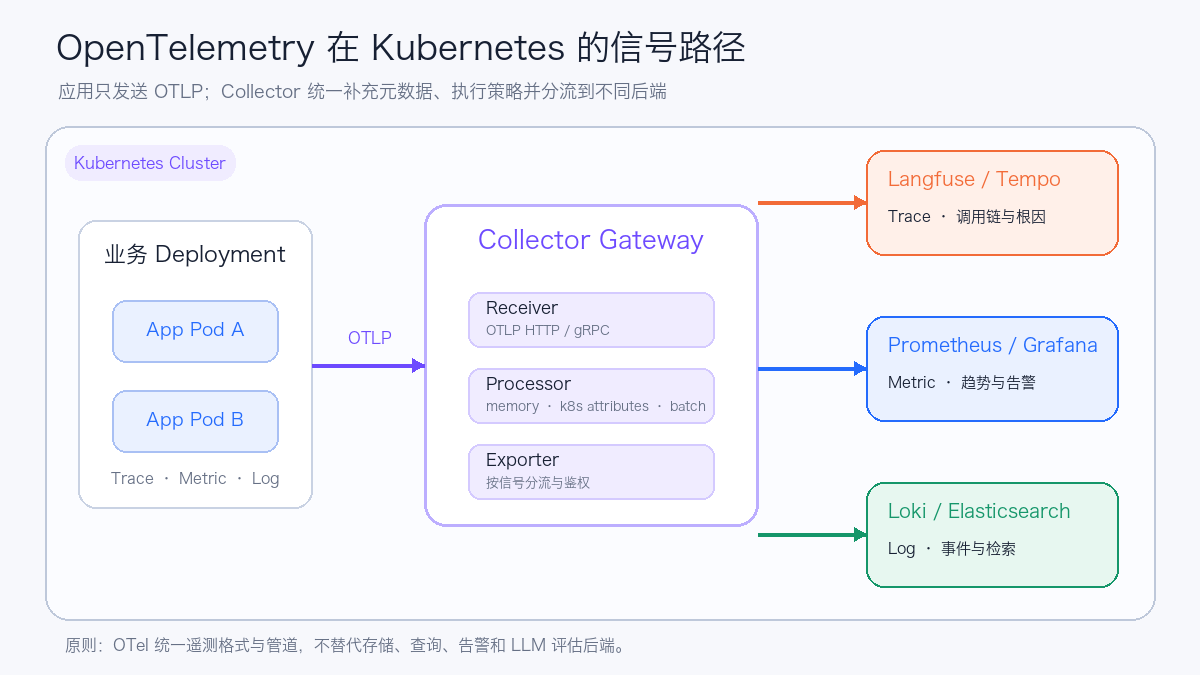
2. The Collector's Pipeline Model
Collector configuration consists of four types of components:
receivers:   # 数据从哪里进入
processors:  # 怎样加工、限流、补充属性和批量
exporters:   # 发往哪些后端
extensions:  # 健康检查、鉴权等非数据流水线能力
Only when components are written into service.pipelines do they actually participate in execution:
service:
  extensions: [health_check, basicauth/langfuse]
  pipelines:
    traces:
      receivers: [otlp]
      processors: [memory_limiter, k8s_attributes, resource/common, batch]
      exporters: [debug, otlp_http/langfuse]
    metrics:
      receivers: [otlp]
      processors: [memory_limiter, k8s_attributes, resource/common, batch]
      exporters: [prometheus]
    logs:
      receivers: [otlp]
      processors: [memory_limiter, k8s_attributes, resource/common, batch]
      exporters: [debug]
The order here has practical meaning. memory_limiter should reject data exceeding the memory budget as early as possible, to avoid the Collector being overwhelmed by traffic bursts; k8s_attributes enriches data with Pod, Namespace, Deployment, and Node; batch then merges export requests to reduce backend connection overhead.
The experiment uses Collector Contrib 0.160.0. This version has normalized some historical component aliases; for example, the configuration uses k8s_attributes and otlp_http. When upgrading the Collector, run the actual configuration in a pre-production environment; do not rely only on whether the YAML syntax passes.
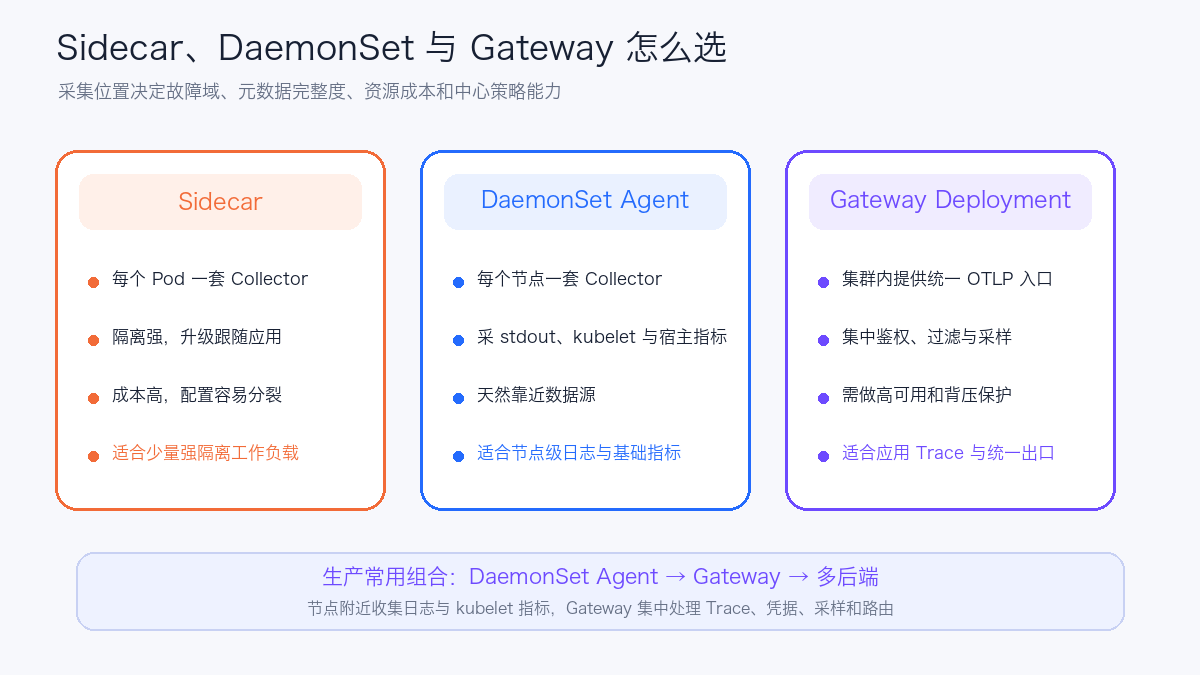
3. Sidecar, DaemonSet, and Gateway
No single Collector deployment shape fits all signals.
3.1 Sidecar
Each business Pod carries a Collector. This provides strong isolation and independent configuration, but significantly increases Pod count, CPU, memory, and upgrade costs. It is only worth using when a small number of tenants need independent credentials, independent failure domains, or special processing logic.
3.2 DaemonSet Agent
One Collector runs per node, suitable for reading container stdout files, Kubelet Stats, and host metrics. Log files are local to the node, so a DaemonSet can read them via a shorter path; applications can also send OTLP to the node-local Agent.
3.3 Gateway Deployment
The Collector runs as a Deployment providing a unified OTLP Service; applications only configure one in-cluster address. Authentication, filtering, sampling, routing, and backend credentials are centrally managed, suitable for application traces and a unified egress. This experiment uses this structure.
A common production combination is:
DaemonSet Agent
  ├─ filelog / kubeletstats / hostmetrics
  └─ OTLP from local workloads
        ↓
Gateway Deployment
  ├─ central policy / sampling / routing
  └─ credentials and multi-backend export
When Tail Sampling is involved, Spans belonging to the same Trace must stably reach the same set of stateful Collectors; simply spreading Spans randomly across multiple Gateway replicas prevents the sampler from seeing the complete Trace. The OpenTelemetry project recommends two-layer routing with Trace ID or service-name awareness when specific Collector state is required.
4. Experiment Environment and Boundaries
The environment already has Prometheus Operator, Prometheus, Grafana, and self-hosted Langfuse. OpenTelemetry Operator is not installed, so native Deployment, Service, and ServiceMonitor are used:
| Item | Experiment configuration |
|---|---|
| Kubernetes | Server v1.30.4 |
| Collector | otel/opentelemetry-collector-contrib:0.160.0 |
| Application | FastAPI, two replicas |
| OTLP | Application to Collector with both HTTP 4318 and gRPC 4317 enabled; the sample application uses HTTP |
| Trace backend | Self-hosted Langfuse, via OTLP/HTTP |
| Metric backend | Collector Prometheus Exporter + ServiceMonitor |
| Log backend | This experiment only verifies the pipeline with the Debug Exporter; no claim of completed log persistence |
The manifests do not create Prometheus, Grafana, or Langfuse. Before deployment, confirm the target cluster already has the corresponding backends, and adjust ServiceMonitor labels and the Langfuse Service address.
5. Application Instrumentation: Automatic Spans Combined with Business Spans
The sample application uses both FastAPI automatic instrumentation and manual business Spans:
FastAPIInstrumentor.instrument_app(
    app,
    tracer_provider=trace_provider,
    meter_provider=meter_provider,
    excluded_urls="/healthz",
    exclude_spans=["send", "receive"],
)

with tracer.start_as_current_span("validate-order") as span:
    span.set_attribute("demo.mode", mode)

with tracer.start_as_current_span("inventory-call") as span:
    span.set_attribute("peer.service", "inventory")

with tracer.start_as_current_span("format-response"):
    ...
A normal request forms the following structure:
An error request raises an exception in inventory-call, so there is no format-response, resulting in three Spans. The root Span must be preserved: the Trace backend needs it to build the complete chain; if the filter leaves only child Spans, the page may show orphaned Observations.
Metrics are also emitted by the same SDK:
request_counter = meter.create_counter("demo.requests")
latency_histogram = meter.create_histogram(
    "demo.request.duration",
    unit="ms",
)

request_counter.add(1, {"demo.mode": mode, "demo.result": result})
latency_histogram.record(duration_ms, {"demo.mode": mode, "demo.result": result})
demo.mode and demo.result have only a few fixed values, suitable as Prometheus Labels. Trace IDs, Prompts, user IDs, exception stack traces, and arbitrary request parameters should not become Metric Labels directly; doing so causes high cardinality and sensitive information leakage.
6. Kubernetes Metadata Correlation
The application writes the Pod UID into the OTel Resource via the Downward API:
Resource.create({
    "service.name": "checkout-demo",
    "service.version": "1.0.0",
    "deployment.environment.name": "lab",
    "k8s.pod.uid": os.getenv("K8S_POD_UID"),
})
The Collector then matches Pods by UID or connection source and extracts controlled fields:
k8s_attributes:
  auth_type: serviceAccount
  pod_association:
    - sources:
        - from: resource_attribute
          name: k8s.pod.uid
    - sources:
        - from: connection
  extract:
    metadata:
      - k8s.namespace.name
      - k8s.deployment.name
      - k8s.pod.name
      - k8s.pod.uid
      - k8s.node.name
Relying only on connection IP may cause incorrect correlation in proxy, NAT, or multi-layer Collector scenarios; explicitly carrying the Pod UID is more stable. The Collector's ServiceAccount only needs read access to Pod, Namespace, Node, and related Workload metadata; it must not be granted cluster-admin privileges merely for "convenience."
7. Exporting Traces to Langfuse
Langfuse's OpenTelemetry endpoint receives Traces at /api/public/otel, currently supporting OTLP/HTTP JSON or Protobuf, not OTLP/gRPC. The Collector uses Basic Auth and adds a version Header for real-time ingestion in Langfuse v4:
extensions:
  basicauth/langfuse:
    client_auth:
      username: ${env:LANGFUSE_PUBLIC_KEY}
      password: ${env:LANGFUSE_SECRET_KEY}

exporters:
  otlp_http/langfuse:
    endpoint: ${env:LANGFUSE_OTLP_ENDPOINT}
    headers:
      x-langfuse-ingestion-version: "4"
    auth:
      authenticator: basicauth/langfuse
Credentials come from a Kubernetes Secret; they must not be written into ConfigMaps, articles, images, or Git. When using self-hosted Langfuse v3, the OTel endpoint requires at least v3.22.0; older versions return 4xx.
General business Traces can go to Tempo or Jaeger; for LLM/Agent scenarios that also need model, Token, cost, Prompt version, and evaluation semantics, supplement with GenAI Semantic Conventions or langfuse.* attributes. Sending only plain HTTP Spans into Langfuse shows the call chain but does not magically produce Token costs.
8. Metrics into Prometheus
This article chooses the Collector's Prometheus Exporter to expose metrics on 8889, then lets Prometheus scrape via ServiceMonitor:
apiVersion: monitoring.coreos.com/v1
kind: ServiceMonitor
metadata:
  name: otel-practice
spec:
  selector:
    matchLabels:
      app: otel-collector
  endpoints:
    - port: metrics
      interval: 15s
Prometheus can also receive OTLP/HTTP Metrics directly, but the receiver is disabled by default and requires explicitly enabling --web.enable-otlp-receiver. Clusters that already have Prometheus Operator should continue using pull mode, preserving the operational semantics of Targets, up, and service discovery; migration cost is usually lower.
PromQL examples:
# 每种结果的请求速率
sum by (demo_mode, demo_result) (
  rate(otel_demo_demo_requests_total[5m])
)

# 每种模式的平均延迟
sum by (demo_mode) (
  rate(otel_demo_demo_request_duration_milliseconds_sum[5m])
)
/
sum by (demo_mode) (
  rate(otel_demo_demo_request_duration_milliseconds_count[5m])
)

# P95 延迟
histogram_quantile(
  0.95,
  sum by (le, demo_mode) (
    rate(otel_demo_demo_request_duration_milliseconds_bucket[5m])
  )
)
The repository also provides an importable grafana-dashboard.json containing four panels: Collector Target, request rate, average latency, and P95. When importing, select the actual Prometheus data source.
Production dashboards should use rate() or increase() to observe window deltas. When directly summing cumulative Counters, after a rolling update the time series of the old service.instance.id may still be within the Prometheus lookback window, briefly summing old and new instances together.
9. Deployment and Verification
Build and push the sample application image:
cd examples/opentelemetry-kubernetes-practice
docker build -t <REGISTRY>/otel-k8s-demo:v1 app
docker push <REGISTRY>/otel-k8s-demo:v1
In k8s/app.yaml, replace REPLACE_WITH_IMAGE with the actual image, then create Langfuse credentials:
kubectl apply -f k8s/namespace.yaml
kubectl -n otel-practice create secret generic langfuse-credentials \
  --from-literal=public-key='<PUBLIC_KEY>' \
  --from-literal=secret-key='<SECRET_KEY>'
Adjust LANGFUSE_OTLP_ENDPOINT and ServiceMonitor labels, then deploy:
kubectl apply -f k8s/collector.yaml
kubectl apply -f k8s/app.yaml

kubectl -n otel-practice rollout status deploy/otel-collector
kubectl -n otel-practice rollout status deploy/checkout-demo
kubectl create -f k8s/load-job.yaml
Acceptance must not stop at Pod Running. Verify at least four layers of evidence:
# 1. 应用确实产生正常、慢和错误请求
kubectl -n otel-practice logs -l app=checkout-demo

# 2. Collector 收到并导出 Span,且无持续 exporter error
kubectl -n otel-practice logs deploy/otel-collector

# 3. Prometheus Target 为 Up,Metric 能查询
sum by (demo_mode, demo_result) (otel_demo_demo_requests_total)

# 4. Trace 后端能查到根 Trace 和子 Span
# 在 Langfuse 中筛选 GET /work,并核对 slow/error 链路
An HTTP request returning 200 only proves the business entry point works; it does not prove the Collector received the data, the backend ingested it, or that Metric labels and Trace parent-child relationships are correct.
10. Measured Results
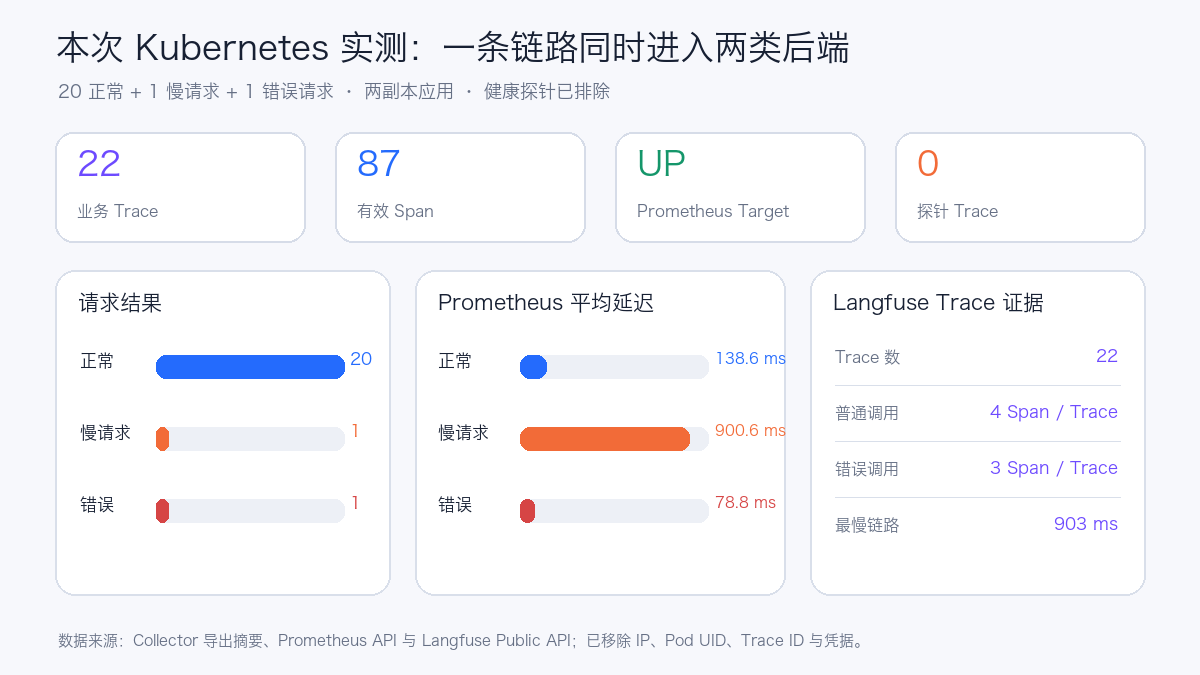
| Evidence | Measured result | What it proves |
|---|---|---|
| Business requests | 20 normal, 1 slow, 1 error | The three known paths actually executed |
| Collector Spans | 87 | 22 root calls and their business child Spans fully entered the Collector |
| Langfuse Traces | 22 | Every business request is findable in the Trace backend |
| Normal Trace | 4 Spans / Trace | Parent-child structure of root Span and three business Spans is complete |
| Error Trace | 3 Spans / Trace | No fabricated formatting steps after the exception occurred |
| Langfuse latency range | 80–903 ms | The injected slow request is clearly visible on the Trace side |
| Prometheus average latency | Normal 138.55 ms, slow 900.65 ms, error 78.80 ms | Metrics match the preset request patterns |
| ServiceMonitor | up = 1 |
Prometheus is scraping metrics exposed by the Collector |
| Health probe Traces | 0 | Probe noise has been excluded |
The slow request and error request each have only one sample; their P95 values only prove the Histogram pipeline works and cannot be used to interpret the service's tail latency level. To draw performance conclusions, you need a fixed request distribution, duration, concurrency, warm-up, sample size, and backend sampling rules.
11. Three Problems Encountered in the Experiment
11.1 Health Probes Generating Large Numbers of Traces
Two application replicas execute liveness and readiness every ten seconds. FastAPI automatic instrumentation initially recorded /healthz as well, and a simple request also produced internal ASGI send/receive Spans; business traffic was quickly drowned out by probes.
Two measures were applied in the end:
After the fix, waiting two probe cycles produced no new Traces in the Collector; then running 22 business requests yielded 87 Spans, exactly matching 21 × 4 + 1 × 3.
11.2 Component Alias Warnings After Collector Upgrade
When the old configuration uses legacy aliases, Collector 0.160.0 emits deprecation warnings. After switching to the current component identifiers and restarting, the warnings disappear. The Collector version, distribution, and configuration should be locked as a set; the upgrade pipeline should first perform configuration loading and a minimal OTLP smoke test.
11.3 Cumulative Metrics Appear Doubled After Rolling Updates
The application SDK emits cumulative Counters, and the Collector Prometheus Exporter uses service.instance.id to distinguish different Pods. During experimental restarts, if you sum the raw Counters directly, the old and new instances may appear simultaneously within the Prometheus five-minute lookback window.
Dashboards use rate()/increase(); during troubleshooting, keep the service.instance.id, Pod, and Target dimensions. When strict single-batch experiments are required, wait for the old application Pods to fully exit, then restart the Collector to clear the receive state, and finally send traffic. This phenomenon also shows that the Metric data flow must satisfy the Single Writer principle—multiple Collectors must not concurrently rewrite the same data stream for the same resource identity.
12. When Integrating AI Agents, the Three Systems Cannot Be Treated Uniformly
OpenTelemetry can unify transport, but different Agents already expose different signals:
| System | Existing Capabilities | Recommended Integration | What Needs Supplementing |
|---|---|---|---|
| OpenClaw | Native OTel Trace, Metric, Log, configurable OTLP/HTTP | Trace goes to Collector first, then to Langfuse/Tempo; Metric to Prometheus, Log to Loki | Content collection is off by default; only use model/Agent Hooks to supplement Spans when native Span hierarchy is insufficient |
| DeepSeek Harness | Official Session Telemetry is mainly OTLP Log, including session events | Log enters the Collector log pipeline; use Cordis plugin or adapter to generate Langfuse Trace | Cannot point /v1/logs directly at the Langfuse Trace entry; session content requires strict desensitization |
| Hermes Agent | Has LLM, API, Tool, Session lifecycle Hooks | Write a lightweight Python plugin that creates Trace, Generation, and Tool Spans in the Hooks | Async batch export, open timeout failure handling, maintain parent-child relationships by turn/session ID |
If you only record requests at the unified model gateway, you get model latency and Tokens, but you cannot see Agent planning, tool execution, retries, or session state. When Agent behavior needs to be evaluated, the instrumentation points must enter the Agent Runtime.
13. Production Configuration Recommendations
13.1 Capacity, Backpressure, and Failure Recovery
- Place
memory_limiterat the front of the processing chain, and set the container memory Limit higher than its upper bound; - Configure bounded send queues, retries, and timeouts for remote Exporters, and define an explicit drop policy when the queue is full;
- When the queue must survive Collector restarts, evaluate the File Storage Extension and persistent volumes;
- Monitor the Collector's own accepted, refused, sent, failed, queue size, CPU, memory, and GC;
- Do not enable a high-detail Debug Exporter in production for extended periods.
13.2 High Availability Does Not Mean Arbitrary Multi-Replica for Every Component
- Stateless OTLP Gateways can run multiple replicas behind a Service load balancer;
- Tail Sampling, Span-to-Metrics, and cumulative-to-delta conversion are stateful and require consistent routing or explicit sharding;
- The Kubernetes Cluster Receiver can normally have only one active instance; otherwise, cluster-level metrics are collected redundantly;
- Starting multiple Prometheus Receiver replicas with the same configuration duplicates scraping; at scale, use a Target Allocator or explicit sharding;
- Metrics must maintain a unique resource identity and Single Writer for each data stream.
13.3 Security and Privacy
- Expose the OTLP Service only on controlled networks, and enable TLS/mTLS and authentication across boundaries;
- Use NetworkPolicy to restrict which Namespaces can send data and which backends the Collector can access;
- Inject credentials only from Secrets; never print keys in Collector configuration or logs;
- Prompts, responses, Tool parameters, Cookie, Authorization, and user identity are not collected by default;
- Establish field allowlists and desensitization rules in the Collector before sending data to external SaaS;
- Prometheus Labels must not contain Trace IDs, raw user IDs, Prompts, or arbitrary URL parameters.
13.4 Sampling Strategies
- Head Sampling is low cost, but at request start you do not yet know whether the request will end in error or be slow;
- Tail Sampling can prioritize retaining errors, slow requests, and key tenants, but requires caching full Traces, with higher memory and routing complexity;
- Sampling rules must have recorded versions, and you must verify that root Spans, error Spans, and key attributes are not filtered out;
- For LLM/Agent scenarios, retention can be combined by error, latency, model, cost, or evaluation scores, but do not use sensitive content as sampling labels.
13.5 Release Gates
Each Collector or SDK upgrade verifies at least:
- A fixed-version image can load the actual configuration;
- Normal, slow, and error Fixtures all produce the expected Traces;
- Root Span and child Span counts, and parent-child relationships, are correct;
- Prometheus Target is Up, and Counter and Histogram are queryable;
- Backend credential errors produce an explicit exporter failure rather than silent loss;
- Health probes, static resources, and high-frequency low-value requests are already noise-reduced;
- After disconnecting the backend, queue, memory, and drop volume fit the budget;
- Public materials do not contain internal addresses, Pod UIDs, Trace IDs, Prompts, or keys.
14. Cleanup Experiment
kubectl delete namespace otel-practice
kubectl delete clusterrolebinding otel-practice-collector
kubectl delete clusterrole otel-practice-collector
ClusterRole and ClusterRoleBinding are cluster-level resources; deleting a Namespace does not automatically delete them. Production installations should manage their lifecycle uniformly through Helm, Operator, or GitOps.