Large-Scale Kubernetes Scheduler Optimization: From Queue Backlog to Parallel Scheduling Architecture
When a large cluster shows a large number of Pending Pods, the first reaction is often to give kube-scheduler more CPU, raise client request quotas, or deploy a few more replicas. These actions can solve part of the problem, but they may also amplify retry, API Server write, and preemption pressure.
Scheduling optimization must answer two questions at the same time: whether a Pod can find a placement in time, and whether the placement found is worthwhile. The former concerns queuing, throughput, and tail latency; the latter concerns resource fragmentation, failure domains, tenant fairness, and overall job success rate. Only increasing the number of Pods bound per second may spread training tasks more quickly across nodes that cannot form a complete job.
This article combines upstream mechanisms with public materials from Alibaba and ByteDance to provide a production evaluation and tuning methodology. Configuration examples are based on Kubernetes v1.30.4; features introduced in newer versions are called out separately. Community cases retain their original environment boundaries; this article does not rewrite them as local ten-thousand-node stress test results.
1. First Break "Slow Startup" into Four Segments
From workload submission to container Ready, there are at least four segments:
| Segment | Start and End | Common Bottleneck |
|---|---|---|
| Workload generates Pods | Submit Job/Deployment → Pod creation | Controller backlog, admission webhooks, API request rate limiting |
| Scheduling queue and decision | Pod enters queue → node found | Insufficient resources, queue retries, Filter/Score plugin overhead |
| Binding and related preparation | Node selected → binding complete | Permit waiting, volume binding, API writes, external extension services |
| Node execution | Pod bound → Ready | Image pull, disk attach, networking, device allocation, application initialization |
Here, Filter is node feasibility filtering, Score is scoring of feasible nodes, and Permit is the extension point that allows binding to continue or waits. If a Pod already has spec.nodeName but is still Pending, the investigation should usually shift to the kubelet, storage, or device chain; continuing to tune scheduler parameters is unlikely to help.
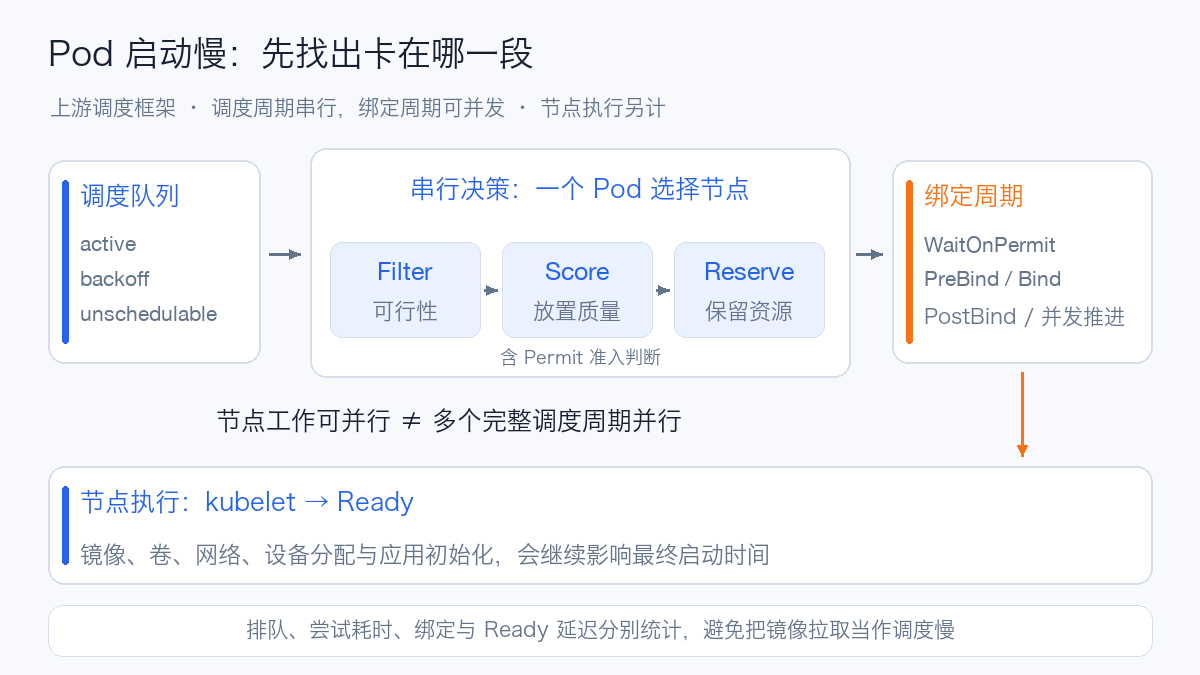
In the upstream scheduling framework, the scheduling cycle runs serially, while the binding cycle can run concurrently. Node-level Filter/Score work can be parallelized, but that does not mean the full scheduling cycles of multiple Pods execute concurrently. Under the same leader election configuration, multiple replicas provide high availability; only the leader performs scheduling. Multiple profiles in one process are also not multiple independent scheduling executors. Kubernetes Scheduling Framework, Scheduler Multiple Profiles
1.1 Which Part Exactly Is "Serial Pod Scheduling"
Think of the scheduler as a front desk assigning meeting rooms. The front desk processes reservations one at a time, but multiple assistants simultaneously check different meeting rooms. After a room is confirmed and occupancy is registered, the person handling access control can continue with the previous reservation while the front desk starts the next one. Room checking, reservation decisions, and subsequent processing are three different levels of concurrency.
| Level | Upstream Mechanism | Optimization Implication |
|---|---|---|
| Node selection decisions for different Pods | Scheduling cycles of the same scheduler run serially | Shorten each decision, or adopt independent scheduling shards |
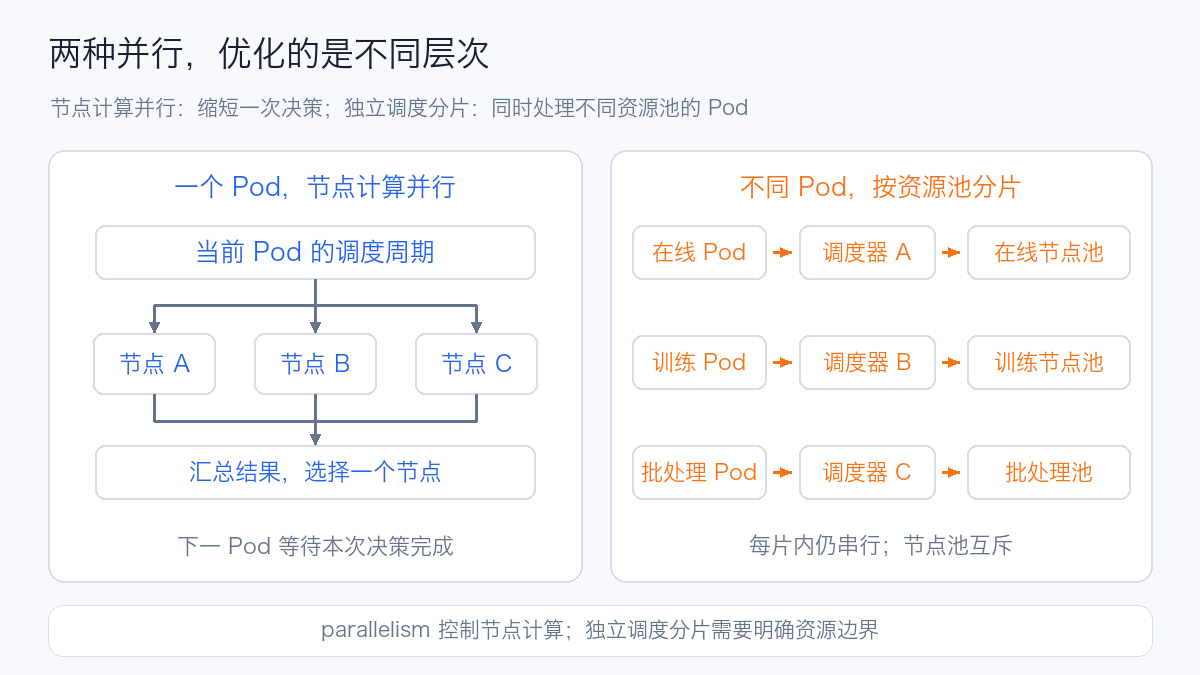
| Computation for one Pod across multiple nodes | Node-level Filter/Score can run in parallel | parallelism and available CPU jointly affect duration |
| Binding work after node selection | Binding cycles for different Pods can run concurrently | Backend writes, volumes, and Permit waits may become bottlenecks |
| Multiple replicas in the same election group | One leader works, the rest are standby | Improves failure recovery, does not directly increase decision throughput |
| Multiple profiles in one process | Share queue and cache, use different policies | Supports policy differentiation, does not add independent decision executors |
This also explains why setting parallelism to 32 cannot be described as "scheduling 32 Pods at the same time." It mainly changes the degree of parallelism available to one request during the node computation phase. Scheduler Configuration Definition, Difference Between Multiple Profiles and Multiple Instances
1.2 Why the Next Pod Can Be Processed Before Binding Completes
In the v1.30.4 source code, after a node is selected, the scheduler first records the resource reservation in the local cache via AssumePod, then executes Reserve and Permit checks, and subsequently advances the binding cycle asynchronously. The next Pod's decision sees the resources already reserved by this process, without waiting for the API Server binding result to return. If binding fails, the cache and plugin reservation state are cleaned up. v1.30.4 Scheduling and Binding Source Code
This local resource reservation cache (assumed cache) belongs to the current scheduler process and is not a global ledger automatically shared across different schedulers. Therefore, directly having multiple independent processes place Pods into the same node pool introduces resource contention; the sharding and parallel architectures discussed later need to address this specifically.
1.3 Estimating Decision Capacity Using Serial Duration
A convenient model for evaluation is:
English rendering — the original text is retained below.
For example, if the average serial phase duration is 20 ms, even if binding can run concurrently, the serial phase alone caps throughput at roughly 50 decisions/second. If search and redundant computation are reduced, bringing the average duration down to 5 ms, the decision capacity becomes roughly 200 decisions/second—a significant improvement even within a serial structure. This is an arithmetic example to explain the bottleneck, not a fixed performance ceiling for kube-scheduler or a measured result from this article. The average serial duration should be used for estimation; a P99 that includes binding cannot be substituted directly. If half of all attempts fail due to insufficient resources, adding more CPU will not automatically create new available nodes.
2. Build a Scheduling Dashboard That Explains Causes
I would first place the queue, attempt results, extension point durations, and backend API on the same timeline, and only then look at CPU. Otherwise, "repeated retries due to insufficient resources" can easily be misjudged as "the scheduler is computing too slowly."
The following names and labels have been verified against the Kubernetes v1.30.4 scheduler metrics source code; plugin-related Alpha metrics and labels in later versions should still be confirmed against the actual /metrics.
| Metric | What to Observe | Common Misreading |
|---|---|---|
scheduler_pending_pods{queue=...} |
active, backoff, unschedulable, gated queues | gated means not yet released, not that node filtering failed |
scheduler_schedule_attempts_total{result,profile} |
Rate of success, unschedulable, internal error | Attempt count is not the number of unique Pods; failed retries also count |
scheduler_scheduling_attempt_duration_seconds |
Duration of a single attempt, including algorithm and binding | Does not include a Pod's full queuing wait |
scheduler_pod_scheduling_sli_duration_seconds |
Scheduling latency after a Pod enters the scheduling queue | Only observable after scheduling completes; Pods stuck for a long time cannot be reflected by this metric |
scheduler_framework_extension_point_duration_seconds |
Duration of Filter, Score, PreBind, and other phases | Phase percentiles cannot be summed directly to form a total P99 |
scheduler_plugin_execution_duration_seconds |
Duration of specific plugins | Labels in 1.30 do not include profile; may be sampled, check actual observation frequency first |
scheduler_queue_incoming_pods_total{queue,event} |
Which event types cause large numbers of re-queues | Must be judged together with object updates and failing plugins |
scheduler_preemption_attempts_total |
Preemption attempt rate | Attempting preemption does not guarantee the Pod will eventually run |
scheduler_unschedulable_pods{plugin,profile} |
Pods rejected by each plugin | A Pod can be counted by multiple plugins; do not sum directly as a total |
scheduler_pod_scheduling_duration_seconds is already marked deprecated in this version; new dashboards should prefer SLI metrics. SLI stands for Service Level Indicator; if the business goal is "Ready within 30 seconds of submission," an end-to-end metric must still be built from submission, Pod creation, and Ready timestamps—the scheduler's histograms cannot be used as a substitute.
A typical query follows. Multi-cluster deployments should retain cluster and add job/instance filtering according to their own collection labels.
# 成功调度吞吐:Pod/s
sum by (cluster, profile) (
  rate(scheduler_schedule_attempts_total{result="scheduled"}[5m])
)

# 队列构成
sum by (cluster, queue) (scheduler_pending_pods)

# 单次成功尝试 P99:秒
histogram_quantile(0.99,
  sum by (cluster, profile, le) (
    rate(scheduler_scheduling_attempt_duration_seconds_bucket{
      result="scheduled"
    }[5m])
  )
)

# 分阶段 P99:秒
histogram_quantile(0.99,
  sum by (cluster, profile, extension_point, le) (
    rate(scheduler_framework_extension_point_duration_seconds_bucket[5m])
  )
)
Do not average the P99 across instances. Histograms must first aggregate buckets under the same definition, then compute percentiles. Also display the observation count; when there are only two scheduling events in five minutes, the explanatory power of P99 is very limited.
| Concurrent Phenomena | Check First |
|---|---|
| active growing continuously, Filter/Score rising, CPU busy | Node search scope, plugin algorithms, lock contention, CPU quota |
| Many unschedulable, CPU not high | requests, GPU types, affinity, taints, volumes, quotas |
| backoff and re-queue rate surging | Invalid event wakeups, failed retries, controller batch updates |
| PreBind/Bind slow, API 429/high latency | Volume controller, API Priority and Fairness (APF), admission, etcd |
| Queue suddenly grows after leader switch | Election time, cache sync, LIST/WATCH and binding recovery |
| Pods bind quickly but training is slow to start | Gang completeness, device topology, images, networking, model loading |
3. Node Search: Search Fewer Nodes, but Find Good Enough Placements
percentageOfNodesToScore is the most discussed and most easily mis-explained parameter. It controls how many feasible nodes must be found before searching can stop, not "only check 10% of all nodes no matter what."
The automatic value varies with scale: the official documentation gives roughly 50% for 100 nodes and 10% for 5000 nodes, with an automatic ratio floor of 5%, and a minimum feasible node count constraint also exists. Explicitly configuring 0 means using the automatic policy. When there are very few nodes, lowering the ratio usually yields little benefit. Scheduler Performance Tuning
Suppose a cluster has 10000 nodes, but only 30 nodes satisfy a certain combination of GPU, network, and local disk requirements. Even with a 10% threshold, 1000 feasible nodes cannot be found, and the search may still traverse a large number of nodes. A low ratio cannot directly solve the problem of sparse candidate nodes.

When tuning, compare the automatic value, 10%, 20%, and 50%, but the same round must also record:
- Filter/Score time, successful Pods/s, and queuing P99;
- Remaining fragmentation of CPU, memory, and GPU;
- Distribution across availability zones, NUMA, and network topology;
- Post-scheduling application latency, training communication efficiency, and preemption volume.
NUMA stands for Non-Uniform Memory Access. GPU jobs may satisfy "four free cards exist" yet still be placed into combinations that span NUMA domains or have weak interconnect. Placing fast and running fast must be validated separately.
Node pools, stable model labels, and concise hard constraints can reduce irrelevant candidates. Plugins that implement candidate set indexing can also converge nodes earlier; however, the upstream nodeSelector does not guarantee fully skipping full-node iteration, so label governance should not be advertised as a fixed tenfold speedup.
4. parallelism, CPU, and Client QPS: Each Solves a Different Problem
Using v1.30.4 as an example, the upstream default parallelism is 16, and the scheduler client default QPS is 50 with a burst of 100. v1.30.4 Configuration Defaults
The following is used to clarify the baseline and does not itself provide a performance improvement:
apiVersion: kubescheduler.config.k8s.io/v1
kind: KubeSchedulerConfiguration
parallelism: 16
percentageOfNodesToScore: 0
clientConnection:
  qps: 50
  burst: 100
profiles:
  - schedulerName: default-scheduler
In production, retain existing leaderElection, plugins, certificates, kubeconfig, and other configuration; only adjust fields that have been validated. Do not use this minimal example to overwrite existing configuration.
| Adjustment Item | Conditions Where It May Help | Cost of Increasing |
|---|---|---|
| CPU request / CPU quota | CPU saturation or throttling due to CFS quota limits | Host contention, budget increase; inefficient algorithms still remain |
parallelism |
Node-level computation has sufficient parallel work and CPU | Increased memory allocation, lock contention, context switching |
Client qps / burst |
Confirmed client-go rate limiting is slowing writes | Larger API bursts, APF queuing, etcd pressure |
| Scheduler replica count | Leader failure recovery needed | More processes and cache overhead, does not directly increase effective throughput |
QPS stands for Queries/Requests Per Second; here it represents the client's per-second request quota. First distinguish between client-go's own rate limiting, API Server returning 429, network latency, and slow etcd commits, then decide which side's capacity to increase. Raising qps from 50 to 500 cannot fix a Filter plugin that takes 300 ms to execute.
Production profiles should use Go's pprof tool to distinguish: compute hotspots, lock blocking, garbage collection, memory allocation, and waiting on remote services. Restrict profiling endpoints to the operations network and sample for short periods; do not expose debug interfaces directly to all tenants.
4.1 How to Run a Controlled Comparison for Node Parallelism
I would first fix the search ratio, plugins, and workload, confirm the scheduler has sufficient CPU, then compare the default of 16 against lower or higher parallelism values, such as 8 or 32. These numbers are test levels, not recommended configurations for all clusters.
If Filter/Score time decreases, successful Pods/s increases, and queuing tail latency improves, validation can be expanded further; if CPU becomes busier, lock waits and garbage collection increase, but successful throughput stays flat, increasing workers has not achieved its purpose. Throttling caused by CPU quotas must also be ruled out first; otherwise, work is split into more pieces while still contending for the same compute capacity.
When binding is slow, first check client-go rate limiting, API writes, volume preparation, and Permit waits. At that point, faster node computation may simply cause more binding requests to back up simultaneously. Configuration changes should be paired with the full validation in Section 9; do not compare only the duration of a single extension point.
5. Plugin Optimization: Move Repeated Computation Out of the Per-Node Path
In a large cluster, a plugin adding tens of microseconds per invocation, multiplied by thousands of nodes, multiple plugins, and continuous retries, becomes a significant cost.
I would review extension implementations in the following order:
- Prefer informer/lister caches. Do not perform real-time GET/LIST calls to the API Server inside every Filter invocation for every Pod and every node.
- Move shared computation to PreFilter / PreScore. Compute a Pod's requirements, label selectors, and topology counts once, and reuse them via CycleState.
- Fail fast. Once a node is determined to be unable to satisfy hard constraints, do not continue executing expensive logic; when plugin ordering is involved, confirm that diagnostic and state semantics are not changed.
- Reduce temporary objects and large locks. In addition to CPU profiles, check heap, mutex, and block profiles to avoid all node workers contending for a single mutex.
- Give external Extenders explicit latency and failure semantics. Set timeouts on HTTP calls and determine whether a failure means pass or reject; do not silently degrade GPU topology and security constraints.
Scheduling Framework plugins are extensions compiled into the scheduler process; Extenders are external interfaces. The two differ in caching, network cost, and upgrade approach. Scheduling Framework design, Scheduler Extender configuration
Pod affinity and anti-affinity require particular caution in large clusters. Complex selectors spanning many namespaces, high Pod density, and frequent changes all increase computational load. Prioritize stating the requirement clearly: must be on the same node, only need the same availability zone, or prefer spreading out? Requirements that can be expressed as simple topology distribution do not all need to be written as complex inter-Pod relationships; semantic equivalence must be verified before conversion. Pod affinity and scale limits
5.1 A concrete, code-level example: repeatedly parsing selectors
Suppose a custom Filter plugin re-parses the same Pod's selector, computes device requirements, and even calls the API to query node auxiliary information for every node. When checking thousands of nodes, these repeated operations accumulate on a single scheduling path.
| Work in the original implementation | Adjusted placement | Semantics to preserve |
|---|---|---|
| Parse the same Pod requirements for every node | Parse once in PreFilter, write to CycleState | Parse failure still rejects as before; hard constraints cannot be ignored |
| Real-time GET/LIST of node auxiliary objects inside Filter | Informer/lister cache | Explicitly define cache sync, update, and invalidation conditions |
| Recompute node-independent scoring parameters for every node | Prepare once in PreScore | Node resource and topology changes are still computed against correct state |
| All node workers share one big lock | Read-only state or narrowed lock scope | Parallel invocation must remain thread-safe |
CycleState is the state container for the current Pod's scheduling cycle; it does not automatically guarantee thread safety for custom objects. Data read in parallel by Filter/Score should be designed as read-only, and shared objects returned by informers must not be modified. Reusing results across Pods additionally requires equivalence judgment and invalidation mechanisms; the current cycle's cache cannot be treated directly as a long-lived cache. Scheduling Framework extension points
This is a code-review profile, not a measured speedup result from this article. When validating, keep the same node snapshot and Pod set, compare plugin CPU, memory allocation, API call volume, successful throughput, and check item by item whether node selection still satisfies the original constraints. Caching only static labels while incorrectly reusing dynamic available resources turns a performance optimization into incorrect placement.
5.2 GPU fragmentation governance: giving scoring a testable objective
The training resource pool can evaluate the bin-packing score of NodeResourcesFit. For example, include GPU in MostAllocated, preferring nodes that already have more resources allocated among those satisfying requests, to keep fully idle nodes as intact as possible. Kubernetes Resource Bin Packing
Below is a candidate configuration within a profile; the weight is shown to illustrate the syntax, not a recommendation that all environments use 4:
pluginConfig:
  - name: NodeResourcesFit
    args:
      scoringStrategy:
        type: MostAllocated
        resources:
          - name: cpu
            weight: 1
          - name: memory
            weight: 1
          - name: nvidia.com/gpu
            weight: 4
Node resource scoring is based on requests versus allocatable resources, not actual GPU utilization; weights of other Score plugins still affect the final result. This configuration also has no awareness of inter-card NVLink, PCIe, and NUMA combinations, and cannot replace device topology plugins or node-side allocation validation.
During canary rollout, compare a set of real jobs: for the same four-card and eight-card requests, how many fully idle eight-card nodes remain available before and after optimization, how many jobs wait due to fragmentation, whether communication performance degrades, and whether failure domains become overly concentrated. CPU microservices often need to be spread out; the training pool's bin-packing strategy cannot be applied indiscriminately to all online services.
6. Retry governance: do not let unschedulable Pods consume all scheduling capacity
Suppose a tenant submits 10,000 Pods requiring a specific GPU, but resources can only accommodate 1,000. If the remaining Pods are repeatedly woken by frequent node updates, the scheduler will continuously re-prove the same thing: resources are insufficient.
Demand entering the scheduler should first be limited at the job admission and queue layer. Kubernetes' schedulingGates can keep Pods that do not yet meet conditions in the gated state; combined with job admission components such as Kueue, quota and resources are checked first, then the gate is removed. A gate itself does not allocate resources and does not automatically complete Gang scheduling. Pod Scheduling Readiness, How Kueue works
On the retry side, QueueingHint can also be used: based on the plugin that failed last time, determine whether a given event might make the Pod schedulable. It is enabled by default in v1.32 and became stable in v1.34. Early implementations disabled the default switch due to memory issues, so older clusters cannot directly copy the new version's feature gate. v1.32 QueueingHint notes, v1.34 QueueingHint status
The practical goal is to reduce ineffective attempts, not to extend backoff indefinitely. Backoff is the retreat after failure; if too long, Pods that should run immediately after resources are released keep waiting, and if too short, it creates a retry storm. Adjustments must observe both requeue events and recovery latency after resource release.
6.1 Using the success ratio to judge whether queue governance is effective
For example, suppose a test has 100 scheduling attempts per second, of which 80 fail due to insufficient resources and only 20 succeed. The scheduler CPU is busy, but the business gets about 20 Pod/s. If admission and related event wakeups reduce ineffective attempts, further observe whether successful throughput and normal business waiting improve; a decrease in attempt count must not be interpreted as a decline in scheduling capacity.
When comparing, keep separate counts of scheduled, unschedulable, and error attempts, plus the waiting age of unfinished Pods. The successful attempt ratio is computed over the same statistics window for all three attempt categories; it cannot be computed by dividing the current Pending count by the cumulative attempt count. Also verify that jobs recover promptly after resources are released, avoiding the superficial effect of a "quieter queue" created by long backoff. QueueingHint queue and retry mechanism
schedulingGates became stable in v1.30, and QueueingHint became stable in v1.34; a v1.20 cluster cannot directly copy these configurations. Older clusters need to evaluate against existing job queues, submission controls, and the event wakeup mechanism of the corresponding version; a version upgrade can also be included in the optimization roadmap. Scheduling Readiness version notes
Preemption must also be counted in this ledger. High-priority Pods cannot necessarily satisfy hard affinity, topology, or volume conditions through preemption; large amounts of repeated preemption generate evictions, rebuilds, and Events. PDB is the Pod Disruption Budget; upstream preemption's protection of it is best-effort and cannot promise it will never be violated. Prioritize constraining the scope of high-priority usage, and pair long training jobs with recoverable checkpoints. Pod Priority and Preemption
7. Alibaba's practice: beyond throughput, solving quota and job integrity
Alibaba's 2019 ten-thousand-node control plane sharing used 10,000 Nodes, 200,000 Pods, and a million objects as the test profile, finding that storage, controller recovery, and scheduling were stressed simultaneously. Its value lies in placing the scheduler back into the full control loop: slow backend APIs, cold cache startup, and object storms all slow scheduling together. The article is older, and its improvements cannot be directly treated as features still missing from the current version. Alibaba's control plane optimization at ten-thousand-node scale
Alibaba engineers further discussed Capacity Scheduling and batch job scheduling in their Kubernetes scheduling extension sharing. The corresponding production problems are: whether one tenant permanently occupies idle quota, and whether multi-process jobs can obtain resources together. Alibaba: extending the Kubernetes scheduler for AI and big data jobs
Koordinator's ElasticQuota supports hierarchical quotas and borrowing/returning; Coscheduling supports Gang, meaning a group of Pods advances together after meeting minimum readiness conditions. These capabilities can improve shared resource pool usage, but they add objects and state management such as quota, PodGroup, and Reservation, and plugin latency and failure recovery still need to be measured. Koordinator v1.6 ElasticQuota, Koordinator components and scheduling plugins
For an eight-process training job, I care more about "how long it takes for all eight processes to be runnable" than how quickly the first Pod binds. Otherwise, it is easy to end up with four jobs each holding two cards, GPU fully occupied, yet no job able to start.
This kind of problem is best solved at the job layer: admission first, then Gang/reservation, and finally node and device placement. Adding CPU to the default scheduler cannot replace this layer of resource management.
8. How multiple Pods run in parallel: sharding and shared pool architectures
After single-Pod computation is optimized, if serial decisions still cannot absorb the submission peak, two directions must be distinguished: splitting into independent resource pools, or designing concurrent decisions and conflict handling on a shared resource pool.
8.1 Independent node pools: multiple schedulers deciding separately
If online services, training jobs, and batch processing already have clear resource boundaries, independent scheduler processes can be evaluated. Pods use different spec.schedulerName, each scheduler has an independent election lock, and hard constraints limit each to its own node pool.
| Workload | schedulerName example | Node boundary | Primary goal |
|---|---|---|---|
| Online services | online-scheduler |
Online node pool | Reduce interference from batch submissions on online scaling |
| GPU training | training-scheduler |
GPU training node pool | Independently handle device, quota, and job constraints |
| CPU batch processing | batch-scheduler |
CPU batch node pool | Absorb burst tasks and evaluate bin-packing strategies |
This is a candidate architecture, not a three-shard deployment already implemented in this article. Each process can run its own scheduling cycle concurrently, and each process still makes decisions serially within itself, following the upstream approach. Each shard is then configured with standby replicas to address that shard's high availability.
Canary rollout requires both sides to respect resource boundaries: limit the training scheduler to the GPU pool, and ensure other schedulers do not place workloads into the same pool. Merely changing a Pod's schedulerName, or adding one-way node affinity, does not guarantee isolation. Configuring multiple profiles within one process also cannot replace multiple independent shards. Multi-scheduler deployment principles, Independent scheduler and election lock configuration
The cost of sharding includes more caches and Watches, uneven shard load, and more complex resource borrowing between pools. Three shards do not guarantee three times the throughput: if all are limited by the same API write bottleneck, the final improvement may still be small. Acceptance must examine per-shard and overall successful throughput, queueing time, resource fragmentation, and API/etcd pressure.
8.2 Shared node pool: why simply adding more workers does not work
Suppose a node has only 8 cores left, and two Pods each requesting 8 cores read this idle state at the same time; both may select the node. The API Server's bind operation is not a global resource capacity check, and the assumed caches of two independent schedulers are not shared.
Therefore, parallel scheduling on a shared pool must at least answer: how resources are re-validated at decision submission time, who records reservations, who rejects conflicts, how recovery works after failure, and how cross-node constraints such as preemption and affinity stay consistent. Putting the node selection function into multiple goroutines only completes part of parallel computation.
ByteDance's Gödel is a public case on this path: the Dispatcher distributes scheduling units, multiple Scheduler shards compute placement plans, and the Binder checks conflicts and performs binding; conflicting units are rescheduled. It uses optimistic concurrency, meaning parallel computation is allowed first, then conflicts are detected at the submission stage. Here, computation, validation, and recovery together form the optimization solution. Gödel's architecture and conflict handling
8.3 ByteDance's practice and adaptation boundaries
When ByteDance publicly released Gödel Scheduler in 2024, it reported: in its internal customized environment, a single shard exceeded 2000 Pod/s, multiple shards exceeded 5000 Pod/s, and the largest production cluster exceeded 20,000 nodes and 1 million Pods. These numbers come from ByteDance's public case, not from re-testing in this article, and cannot be directly compared with a simple empty-Pod test. ByteDance releases Gödel Scheduler
There is also a practical boundary: at the time of research, the Gödel repository's Quick Start explicitly listed the Kubernetes compatibility range as 1.21.4–1.24.6. This does not prove that newer versions cannot be adapted, but for a 1.30 cluster it cannot be promised as plug-and-play; branches, APIs, plugins, and maintenance strategy need to be confirmed. Gödel project and compatibility notes
For this kind of architecture, I set three adoption conditions:
- Real profiling has proven that the single-leader serial decision path is the primary bottleneck;
- Requirements still cannot be met after parameter, plugin, and retry governance tuning;
- The team can maintain compatibility, conflict recovery, failure testing, and upstream upgrades.
If the main problems are only training quota and Gang integrity, introducing the corresponding job management capabilities first is usually more direct, without immediately replacing the entire scheduling system.
8.4 Batch reuse: similar Pods do not need to be computed from scratch
Another path is reusing computation results for similar Pods. When a workload continuously submits large numbers of Pods with equivalent scheduling constraints, repeatedly executing the same Filter/Score produces duplicate cost. ByteDance's public practice includes result caching for similar scheduling units; upstream Kubernetes v1.35's Opportunistic Batching also provides a condition-limited result reuse mechanism.
It does not change the full scheduling cycle of multiple Pods into parallel execution; it reduces duplicate computation across consecutive cycles. The v1.35 documentation lists it as a Beta feature enabled by default, but the benefit profile is limited, including inter-Pod affinity, topology spread, and dynamic resource requests; the default topology spread configuration also affects availability. Custom plugins need to support the corresponding signature extension points to express reuse conditions. Topology constraints required by the business cannot be removed just to hit the cache. v1.35 batching conditions, Opportunistic batching design
Deployments on v1.20 or v1.30 cannot gain this capability by adding a parameter with the same name. When evaluating an upgrade or custom implementation, equivalence judgment of scheduling constraints, resource state changes, cache invalidation, and custom plugin compatibility must all be verified together.
9. How to stress test to prove the optimization is effective
Upstream has scheduler_perf integration performance testing, suitable for comparing versions, plugins, and configuration overhead; Kubemark can simulate larger-scale control planes. Neither can automatically replace GPU, volume, and real training startup acceptance. scheduler_perf, Kubemark
I would prepare the following types of profiles, keeping the same set of Pods, node snapshots, order distribution, and resource occupancy:
| Scenario | Purpose | Acceptance criteria beyond throughput |
|---|---|---|
| Large number of small CPU Pods | Measure the basic serial path | Queueing P99, API bind rate |
| Dense Pods with affinity | Amplify relationship computation | Filter plugins, locks, memory |
| GPU / RDMA / topology constraints | Measure sparse candidate sets and placement quality | Number of usable whole nodes, cross-topology communication |
| Some requests deterministically unschedulable | Validate retry governance | Ratio of invalid attempts, whether online Pods are starved |
| PVC with delayed binding | Validate the storage path | PreBind, volume readiness and timeouts |
| Large batches of Jobs submitted at once | Validate admission and Gang | Whole-job startup time, half-occupied resources |
| Scheduler leader switch, batch node changes | Validate failure recovery | Cache synchronization, retries, duplicate/conflicting binds |
RDMA is Remote Direct Memory Access; PVC is PersistentVolumeClaim. These are evaluation scenarios listed here, not stress-test results already executed in this document.
Change only one class of variable at a time. For example, first fix plugins and resources and compare the search ratio; then fix the ratio and compare parallelism; only at the end test client QPS. The submission volume should cover both steady state and bursts, record the denominator of all created Pods, and do not delete timeout and failure samples from the report.
The dashboard should include at least two types of latency: a histogram of successful samples and the age of Pods still waiting. The latter can be computed from Pod creation time, the PodScheduled condition, and Watch records; do not invent a "oldest queue age" metric that does not exist in the current version.
9.1 Map optimization actions to acceptance results
A useful production retrospective should be able to trace from the business symptom all the way to the specific change. The four profiles below are suitable for recording separately, to avoid merely writing "tuned parameters, scheduling got faster."
| Profile | Bottleneck evidence | Candidate changes | Must also verify in parallel |
|---|---|---|---|
| Active queue backlog after large batches of Pods submitted | High Filter/Score, obvious CPU or plugin hotspots | Search ratio, node parallelism, preprocessing and caching | Successful Pods/s, waiting P95/P99, node selection and fragmentation |
| Resource-starved training Pods retrying continuously | Many unschedulable and invalid re-queue events | Job admission, quotas, related-event wakeups | Normal workload waiting, failure ratio, recovery speed after resources are released |
| Online and batch submissions interfering with each other | Obvious differences in per-workflow queueing time | Separate scheduling shards and mutually exclusive node pools | Per-shard throughput, overall utilization, inter-pool idle time and failure recovery |
| Serial decisions still miss the target after basic optimization | Decision latency and queue growth under the same profile | Parallel architecture or batch reuse that satisfies conditions | Conflict rate, recomputation cost, constraint correctness, and backend pressure |
When recording the baseline, write down clearly the node count, Pod density, submissions per second, burst batches, affinity, volume and device conditions, and the ratio of unschedulable requests. With the same 1000 Pods, a pause Pod without constraints and a training Pod with volumes, topology, and Gang will differ greatly in computation and binding cost.
Before and after the change, use the same denominator, the same observation window, and keep timeout samples. Fill in the effects with measured values: successful throughput from what to what, whether waiting tail latency decreased, how many Pods remain unfinished, and whether resource placement regressed. Then record recovery behavior during resource release, scheduler leader switch, and bind failures, so you can judge whether the benefit can survive in production.
The retrospective record is refined progressively through diagnosis, canary, and recovery validation; each conclusion is accompanied by the corresponding raw data, configuration version, and observation window, for later review and continued optimization.
10. Canary, Rollback, and Failure Recovery
The recommended order is "offline replay → isolated node pool → small workload ratio → expanded coverage." The second scheduler uses an independent schedulerName so that trial Pods explicitly select it; the node pool is isolated with selection constraints and taints that both sides honor, not just a one-way affinity added to the new scheduler.
Two independent schedulers placing Pods on the same nodes at the same time do not share their assumed caches. The API Server does not atomically check whether all resources are sufficient, so "bind API succeeded" cannot be treated as no resource contention. If the pool is to be shared, evaluate coordination/reservation mechanisms and failure recovery rather than simply running active-active.
Before going live, place the following evidence in the same change record:
| Item | What to keep |
|---|---|
| Baseline | Version, image digest, full configuration, plugins and node profile |
| Adjustment | Single change, rationale, Profile and Pod scope |
| Performance | Effective Pods/s, queueing and attempt latency, failure denominator |
| Placement quality | Fragmentation, job completeness, cross-topology ratio, business latency |
| Backend impact | API 429s, bind latency, etcd, Events, Informer reconnects |
| Recovery | Primary instance failure, Permit timeout, bind failure, reservation reclamation |
| Rollback | How to restore configuration, and how already-created Pods are handed over |
schedulerName is not a migration switch that can be modified at any time. Canary rollback must have a controller-layer rebuild or takeover plan; you cannot simply scale the new scheduler to zero and leave the Pods already under its responsibility permanently Pending.
When I choose an optimization path, I usually follow this order: first eliminate unsolvable demands and invalid retries, then compress candidate and plugin costs, then correct CPU and API quotas, and finally evaluate parallel scheduling architecture. Each step requires effective throughput improvement without pushing resource fragmentation, online workload interference, or recovery time to a worse position.