DeepSeek-V4.1-Flash Day 0: 8×H20-3e Deployment and Dual-Engine Stress Test
1. Model Architecture and Resource Characteristics
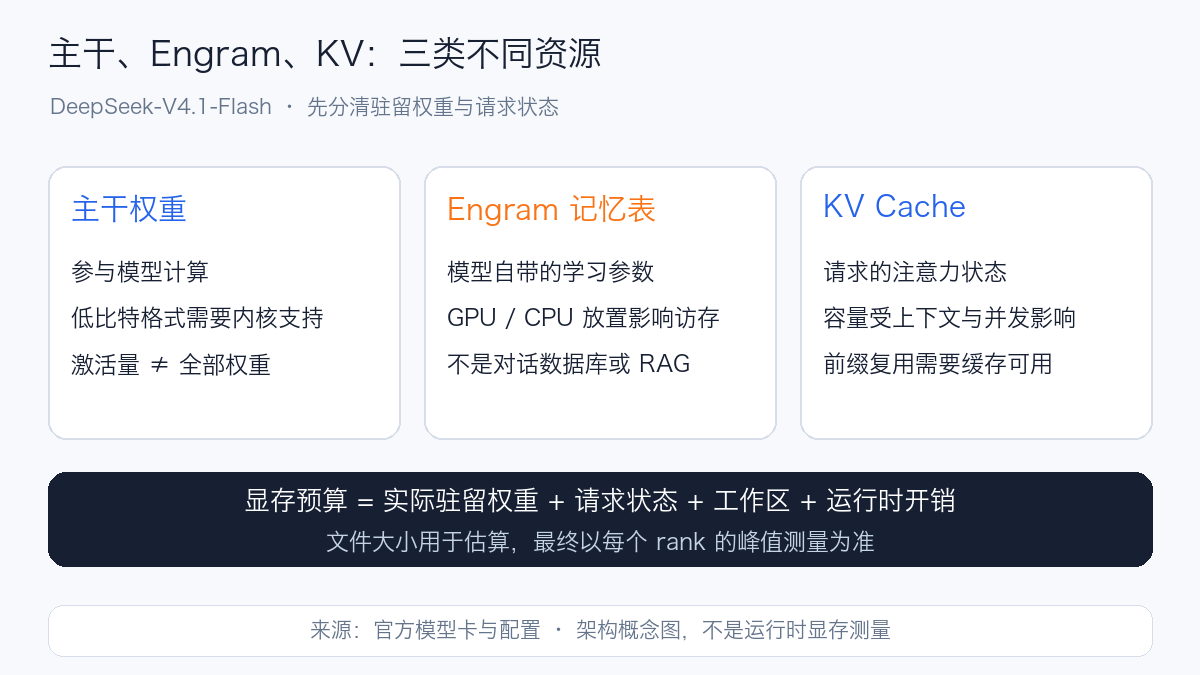
DeepSeek-V4.1-Flash is an open-weight model that supports image and text input and text output. It uses a mixture-of-experts architecture and introduces Engram conditional memory into the model: the official description is 552B backbone parameters plus 196B Engram parameters, with approximately 8B and 16B parameters activated during the Prefill and Decode phases, respectively. The activation counts here primarily describe the parameter volume involved in a single computation, not the full weight set that must be stored at deployment time. Official model card
To understand it, it helps to separate three types of resources: backbone weights handle computation, Engram is the model's built-in learnable memory table, and KV Cache stores the attention state of the current request or reusable prefixes. Engram is not a database that stores previous user conversations, nor is it a RAG retrieval store mounted outside Kubernetes. Placing Engram on CPU changes the memory access path; enabling prefix caching changes computation reuse between requests—the two cannot be conflated as a single optimization switch.
Other changes in the model also directly affect deployment:
| Change | Impact on usage and measurement |
|---|---|
| CED, 20-layer causal encoder plus 20-layer decoder | Prefill and Decode workloads differ; you cannot test only one input/output length |
| CSA2 sparse attention with local window | Long-context budgeting must consider global KV, local state, and workspace simultaneously |
| FP4 expert weights, FP8 other major weights | Requires corresponding packing formats and CUDA kernels; compatibility cannot be judged by "FP8 support" alone |
| Native vision | Must check whether image content and order affect answers; text pass does not substitute for vision pass |
| DSpark speculative decoding | Correctness, acceptance length, and latency should be measured separately; do not enable it by default and mix it into ordinary Decode comparisons |
| New encoding and tool-calling protocol | Use V4.1 native tokenizer, reasoning parser, and tool parser; old V4 configurations cannot be carried over directly |
The above is the official architecture and configuration description; detailed parameters are subject to the pinned config.json and encoding documentation.
The official 1M context capability does not mean any hardware configuration can serve 1M inputs. The official statement about global KV bytes per token also cannot replace an actual GPU memory measurement of the entire inference process. The service limit in this test was set to 32K, with the longest measured input at 24,576 tokens; 1M context was not verified.
2. Test Overview
SGLang and vLLM were run serially on the same eight-card H20-3e machine. Both services loaded successfully, and basic text, multi-turn, tool, and vision samples passed; vLLM achieved higher throughput in multiple tested scenarios but returned empty text under HTTP 200, which was counted as a failed request.
The test used a single node, GPU Engram, and a 32K serving context configuration, covering basic functionality and fixed-length workloads. The vLLM rate-limit scan was terminated after failed requests appeared in three consecutive rounds, leaving data for the last two load tiers missing.
| Item | SGLang | vLLM |
|---|---|---|
| Basic functionality | Text, multi-turn, tool, and streaming passed; vision passed after the fixed sample package | Text, multi-turn, tool, streaming, and vision passed |
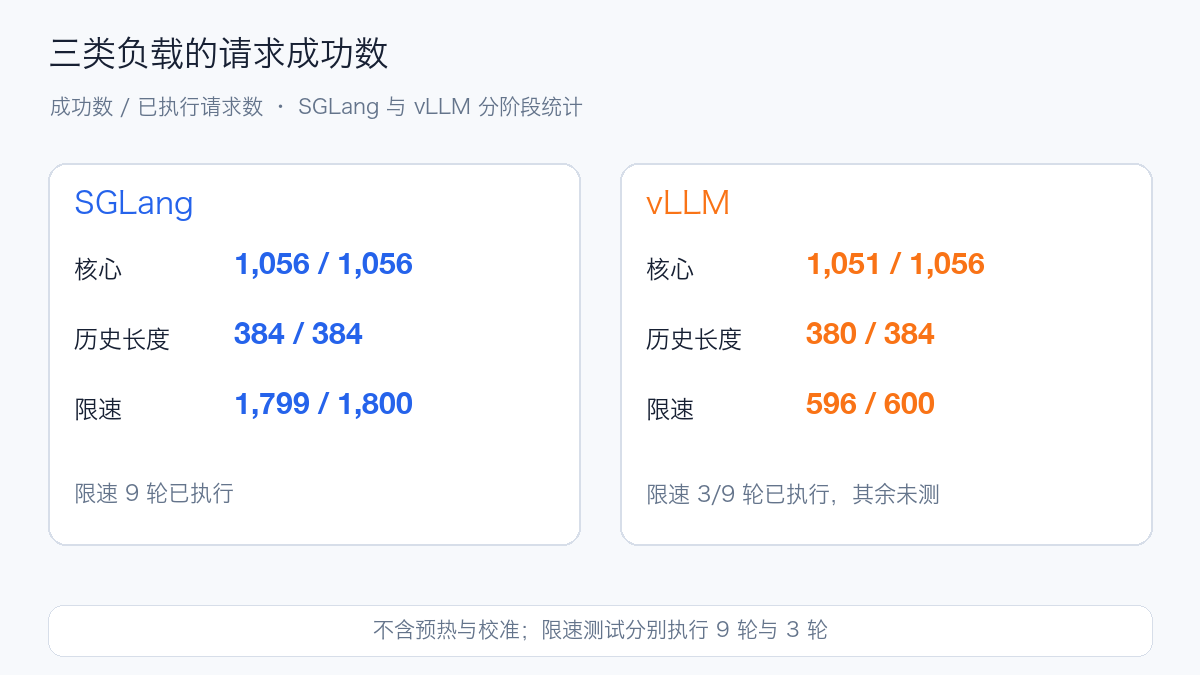
| Core stress test | 36/36 rounds passed, 1,056/1,056 requests succeeded | 32/36 rounds passed, 1,051/1,056 requests succeeded |
| History-length scenarios | 12/12 rounds passed, 384/384 requests succeeded | 8/12 rounds passed, 380/384 requests succeeded |
| Rate-limit scan | 9 rounds executed: 8 passed, 1,799/1,800 requests succeeded | 3 rounds executed: all had failures, 596/600 requests succeeded; remaining 6 rounds not executed |
| History short-text template | 3 rounds, 36/36 requests succeeded | 3 rounds, 81/81 requests succeeded |
"Round passed" means all requests in that round met the client success condition, not that the business SLO was met. The table above excludes warmup and calibration; calibration was SGLang 5/5 rounds passed, vLLM ⅗ rounds passed. The three main tables—core, history-length, and rate-limit—total 108 rounds and 5,280 requests, with 14 failures retained; the history short-text template has an additional 117 requests, not mixed into the main tables.
3. Eight-Card Configuration and Actual Startup
Pinned model snapshot fb2764a5cf321eaa5070ca8f9e892818f477c16d, 48 Safetensors shards totaling 510,296,708,312 bytes, approximately 475.25 GiB. Of these, two Engram shards are approximately 189.13 GiB, and the rest approximately 286.12 GiB. Inference was started only after checking file sizes, headers, and full SHA-256 in the mounted directory; file bytes do not equal runtime GPU memory.
| Condition | This configuration |
|---|---|
| GPU | Single node 8×NVIDIA H20-3e; nvidia-smi reports 143,771 MiB per card, driver 580.126.20 |
| Interconnect | GPUs are NV18 pairwise; GPU 0–3 map to NUMA 0, GPU 4–7 map to NUMA 1 |
| Parallelism | Both engines use TP8 with expert parallelism enabled; serially reusing the same machine |
| Resource request/limit | 64/128 CPU, 512/1,024 GiB memory; 8 GPUs; 64 GiB shared memory |
| Model loading | Same read-only shared filesystem, Engram on GPU |
| Serving scope | Max context 32,768, max running sequences 32; longest measured input 24,576 tokens |
| Optimization switches | Text prefix caching disabled; DSpark and SWA bounded replay not enabled; no CPU Engram comparison |
| Engine | Pinned image digest | Key software |
|---|---|---|
| SGLang V4.1 preview build | sha256:900b6e78f3e3f1725588eaa021c555ab63ad5ee7d0982cd4bca730dc7d83b9b4 |
Torch 2.13.0+cu130; Transformers 5.12.1; FlashInfer 0.6.18 |
| vLLM pinned support branch | sha256:11d2c94063827768882b3a9ba2deca6c6e4fd9492753b651517c87f1fea916cb |
vLLM 0.1.dev1+g79a7108d9; Torch 2.13.0+cu130; Transformers 5.17.0 |
The vLLM build commit is 79a7108d9aea27ddab99ce1779290d300b17fc23, from V4.1 support work. The data in this document corresponds to the above pinned build and parameters. The two engines have different kernel, scheduling, and dependency implementations; measurements must be redone after version upgrades.
AllReduce numerical correctness checks for all eight ranks passed before startup. The actual NCCL versions are SGLang 2.29.7 and vLLM 2.30.7. The check scope is single-node communication correctness and does not include full-matrix bandwidth or cross-node RDMA.
From service startup initiation to Ready, SGLang took approximately 531 seconds and vLLM approximately 390 seconds. SGLang logs show weight loading at approximately 285.78 seconds; vLLM rank 0 weight read logs show 117.93 seconds, with per-rank model loading phases at approximately 82.47–132.48 seconds. The two services accessed the same shared storage sequentially without clearing the file cache; this startup time includes startup checks and model initialization and is for reference only. The weight-phase footprint in logs is approximately SGLang 61.45 GB/rank (original log units) and vLLM 60.25 GiB/rank, not the full peak GPU memory including KV and workspace.
Startup Parameters
The following correspond to the actual parameters used this time; /model is the verified model directory inside the container. The image, GPU capability, and shared volume should be provided by the deployment environment.
sglang serve --model-path /model --served-model-name deepseek-v41-flash --tp 8 --ep-size 8 --context-length 32768 --max-running-requests 32 --mem-fraction-static 0.85 --attention-backend dsv4 --moe-runner-backend flashinfer_mxfp4 --reasoning-parser auto --tool-call-parser auto --enable-metrics --disable-radix-cache --host 0.0.0.0 --port 30000
The SGLang environment variable SGLANG_ENABLE_DSV41_ENGRAM_HOST_TABLE=0 pins GPU Engram. vLLM explicitly disables CPU offload:
vllm serve /model --served-model-name deepseek-v41-flash --tensor-parallel-size 8 --enable-expert-parallel --max-model-len 32768 --max-num-seqs 32 --max-num-batched-tokens 8192 --gpu-memory-utilization 0.85 --tokenizer-mode deepseek_v41 --reasoning-parser deepseek_v41 --tool-call-parser deepseek_v41 --enable-auto-tool-choice --engram-config '{"cpu_offload":false}' --no-enable-prefix-caching --host 0.0.0.0 --port 30000
4. Measurement Method and Prompts
The core matrix is 1,024/128, 8,192/128, 1,024/512, 24,576/128 tokens, each tested at C1, C8, C32, with each group warmed up separately and then formally repeated for three rounds. Request counts per round are 8, 16, and 64, respectively. C is the client concurrency cap; the server-side max running sequences is also 32. Performance requests go through /v1/completions, using the same synthetic random text, temperature=0, fixed output length, and ignore_eos=true; it does not represent real question-answering quality.
Both engines share the vLLM native bench CLI's scheduling and dataset generation, with the same client image and request validation code pinned. The adapter code SHA-256 is 1c02882a16a8ce4db7188f418e89339502bbd5e25f2ac36028275e5527988184. Success requires HTTP 200, non-empty text, [DONE], valid usage, fixed output length, and no SSE error. The native client may count empty fragments as first tokens, so timing was redone and raw SSE was saved; the simulated regression only validates the client and is not counted toward model results.
- TTFT: from request issuance to the first non-empty text fragment. The performance interface's text no longer splits reasoning/final; chat functionality tests separately check the final answer.
- Per-request average TPOT: time from the first fragment to the last generated content, divided by
completion_tokens - 1; the TPOT P95 in the tables is the quantile of these per-request averages, not the P95 of per-token intervals. One chunk can contain multiple tokens. - Throughput: output tokens counted from successful requests divided by the full round duration; failed requests still consume duration and remain in the success-rate denominator.
- Aggregation: tables show the median of three rounds; chart lines show the minimum to maximum across three rounds. Latency counts only successful requests; full-stream E2E is saved separately in the data attachment. The median of three-round P95 is not the P95 of all requests combined; the small sample does not support reliable P99.
Functional requests go through the chat interface and are allowed to end normally, using reasoning_effort: "low". Some actual prompts are as follows:
| Capability | Actual prompt / operation | Validation result |
|---|---|---|
| Arithmetic | 计算 17 加 25,只回答数字。 |
Both engines' final answer is 42 |
| Multi-turn | Remember code 482619. → What was the code? Reply only with the code. |
Returns 482619 |
| Tool | Use get_weather to look up weather in Beijing. Do not invent the weather. |
Tool name, arguments, and simulated result round-trip passed; not a real-time weather validation |
| Single image | Name the main vegetable shown. Reply with one English noun only. |
Official carrots/corn samples both correct |
| Dual image | Name the main vegetable in each image in order. Reply as two English nouns separated by a comma. |
Swapping image order changes the answer accordingly |
| Streaming | Arithmetic request using SSE | End marker, usage, and final answer passed |
SGLang's initial vision check failed because the execution package lacked images; after adding the official images with verified hashes, only the vision check was rerun and passed, with the initial missing-image failure recorded separately. The two vegetable samples only demonstrate limited content and order sensitivity and do not constitute a full vision evaluation. "Success" in the core/history/rate-limit tables also only validates transport and fixed-output conditions, not the semantic quality of generated content.
5. Core Performance: Throughput, Wait Time, and Failures Together
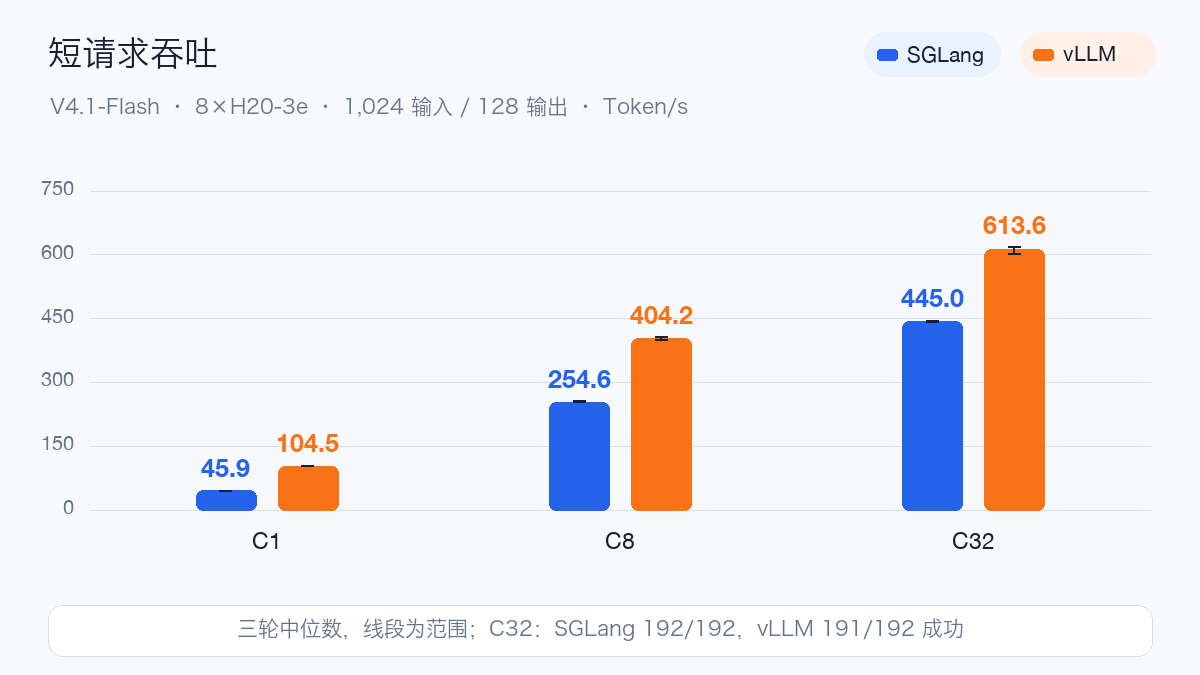
Short-request C1 output throughput is SGLang 45.85 Token/s and vLLM 104.52 Token/s; at C32 they are 445.03 and 613.56 Token/s respectively, but vLLM C32 had 1/192 requests fail. The 1,024/512 C32 scenario is 824.70 and 1,219.46 Token/s respectively, with vLLM again having 1/192 requests fail. Higher throughput and all requests returning valid results are two separate conditions.
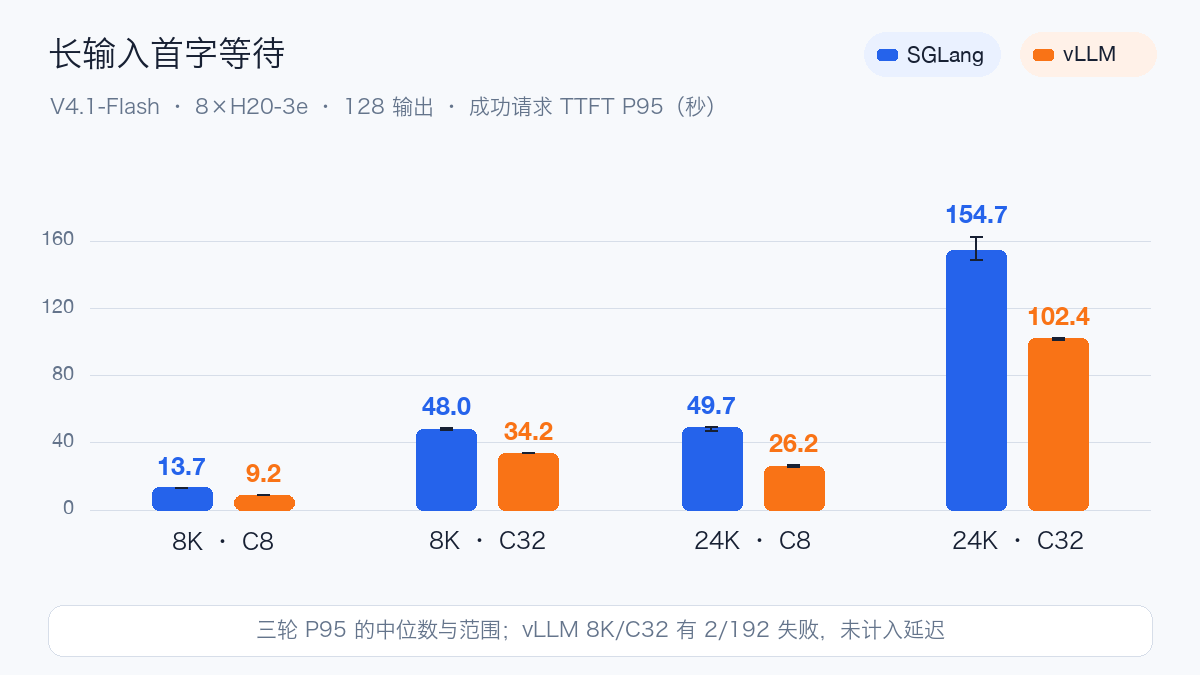
Under long inputs, even when all requests complete, the interactive experience may be unacceptable. The 24K/C32 scenario TTFT P95 reaches SGLang 154.683 seconds and vLLM 102.401 seconds. This test only records the phenomenon under this concurrency and scheduling configuration; no separate profiling was used to attribute contributions from waiting, Prefill chunking, and Decode interference, so it cannot be directly attributed to any single kernel.
| Input/Output Tokens | Concurrency | Engine | Success/Requests | Output Tokens/s | TTFT P95 (s) | TPOT P95 (ms) |
|---|---|---|---|---|---|---|
| 1,024/128 | 1 | SGLang | 24/24 | 45.85 | 0.248 | 20.202 |
| 1,024/128 | 1 | vLLM | 24/24 | 104.52 | 0.198 | 8.153 |
| 1,024/128 | 8 | SGLang | 48/48 | 254.58 | 1.462 | 20.864 |
| 1,024/128 | 8 | vLLM | 48/48 | 404.25 | 1.176 | 18.216 |
| 1,024/128 | 32 | SGLang | 192/192 | 445.03 | 5.686 | 49.658 |
| 1,024/128 | 32 | vLLM | 191/192 | 613.56 | 4.463 | 42.975 |
| 8,192/128 | 1 | SGLang | 24/24 | 31.14 | 1.567 | 20.211 |
| 8,192/128 | 1 | vLLM | 24/24 | 57.71 | 1.197 | 8.112 |
| 8,192/128 | 8 | SGLang | 48/48 | 63.64 | 13.650 | 95.146 |
| 8,192/128 | 8 | vLLM | 48/48 | 97.63 | 9.194 | 72.579 |
| 8,192/128 | 32 | SGLang | 192/192 | 76.79 | 48.045 | 370.468 |
| 8,192/128 | 32 | vLLM | 190/192 | 106.39 | 34.190 | 265.312 |
| 1,024/512 | 1 | SGLang | 24/24 | 48.52 | 0.247 | 20.219 |
| 1,024/512 | 1 | vLLM | 24/24 | 115.17 | 0.197 | 8.335 |
| 1,024/512 | 8 | SGLang | 48/48 | 350.16 | 1.466 | 20.328 |
| 1,024/512 | 8 | vLLM | 48/48 | 613.74 | 1.177 | 12.597 |
| 1,024/512 | 32 | SGLang | 192/192 | 824.70 | 5.679 | 33.474 |
| 1,024/512 | 32 | vLLM | 191/192 | 1219.46 | 4.458 | 23.859 |
| 24,576/128 | 1 | SGLang | 24/24 | 16.85 | 5.064 | 20.241 |
| 24,576/128 | 1 | vLLM | 23/24 | 27.73 | 3.604 | 8.072 |
| 24,576/128 | 8 | SGLang | 48/48 | 19.59 | 49.718 | 312.160 |
| 24,576/128 | 8 | vLLM | 48/48 | 35.09 | 26.228 | 187.417 |
| 24,576/128 | 32 | SGLang | 192/192 | 22.79 | 154.683 | 1330.067 |
| 24,576/128 | 32 | vLLM | 192/192 | 36.30 | 102.401 | 814.965 |
Each cell above is the result of three rounds of statistics; the success count is the total across three rounds. All rounds, ranges, full-stream E2E, and failure summaries are in the JSON summary and per-round CSV. The attachments include SHA-256 hashes of the raw result files for source verification.
6. Rate-Limit Scan: Request Success and SLO Compliance Viewed Separately
Using a common absolute request rate derived from the SGLang 8K/128, C32 calibration reference of approximately 0.60 requests/s, scaled by 0.5, 0.8, and 1.1, i.e., 0.300, 0.480, and 0.660 requests/s. Each round has 200 requests, three rounds per tier, with no client-side concurrency cap while the server remains limited to 32. This is the scan axis, not a percentage of each engine's production capacity.
| Requests/s | SGLang Success/Requests | vLLM Success/Requests | TTFT P95 s: S / V | TPOT P95 ms: S / V |
|---|---|---|---|---|
| 0.300 | 600/600 | 596/600 | 6.074 / 3.249 | 89.428 / 38.643 |
| 0.480 | 599/600 | Not executed | 8.746 / — | 236.511 / — |
| 0.660 | 600/600 | Not executed | 26.138 / — | 371.230 / — |
Under the experimental thresholds of TTFT ≤3 s and per-request average TPOT ≤50 ms, the compliance ratios at the 0.300 requests/s tier were 45.5% for SGLang and 88.5% for vLLM (median of per-round ratios, with failed requests counted as non-compliant); this is not a formal SLO agreed upon by any business. Client-side arrival scheduling skew and CPU saturation have not undergone independent review, so a precise maximum sustainable request rate cannot be derived from this scan.
vLLM succeeded in three rounds at 199/200, 198/200, and 199/200, triggering the executor's "three consecutive failed rounds, stop current phase" protection. The remaining six rounds were not executed, so there is no dual-engine comparison at the high-load tiers. The stop condition is determined by whether any request in a round failed.
7. Why HTTP 200 Still Counts as Failure
Across the three formal test categories (core, history length, and rate limit), vLLM had 13 anomalous requests. After offline decoding of the raw SSE, all of them had HTTP 200, [DONE], and completion usage, but the concatenated choices[].text length was zero. Calibration and warm-up also exhibited failures of the same kind, which were not mixed into the denominator of these 13 formal requests.
{
  "http_status": 200,
  "done": true,
  "completion_tokens": 128,
  "visible_text_length": 0,
  "accepted_as_success": false
}
This is a redacted field summary of one sample, not all requests. The sample uses fixed-length synthetic input and ignore_eos=true through the /v1/completions path, and cannot be directly extrapolated into an empty-response rate for real chat. Special tokens, decoding filters, model generation, and engine implementation all require further investigation; the current evidence can only confirm the empty-text phenomenon, and the root cause has not been determined.
One formal failure for SGLang occurred in the second round at 0.480 requests/s, with the error ServerDisconnectedError: Server disconnected; that round completed 199/200. The cause of this disconnection has not been determined.
8. Historical V4 Flash: No Evidence of Universal Speedup
Historical references are taken from previous AIBrix V4 experiments, totaling 14 formal phases and 4,329 request records. The closest direct-c1 is a single TP8 engine direct connection, with 533–544 input tokens and 256 output tokens, 35/35 successful.
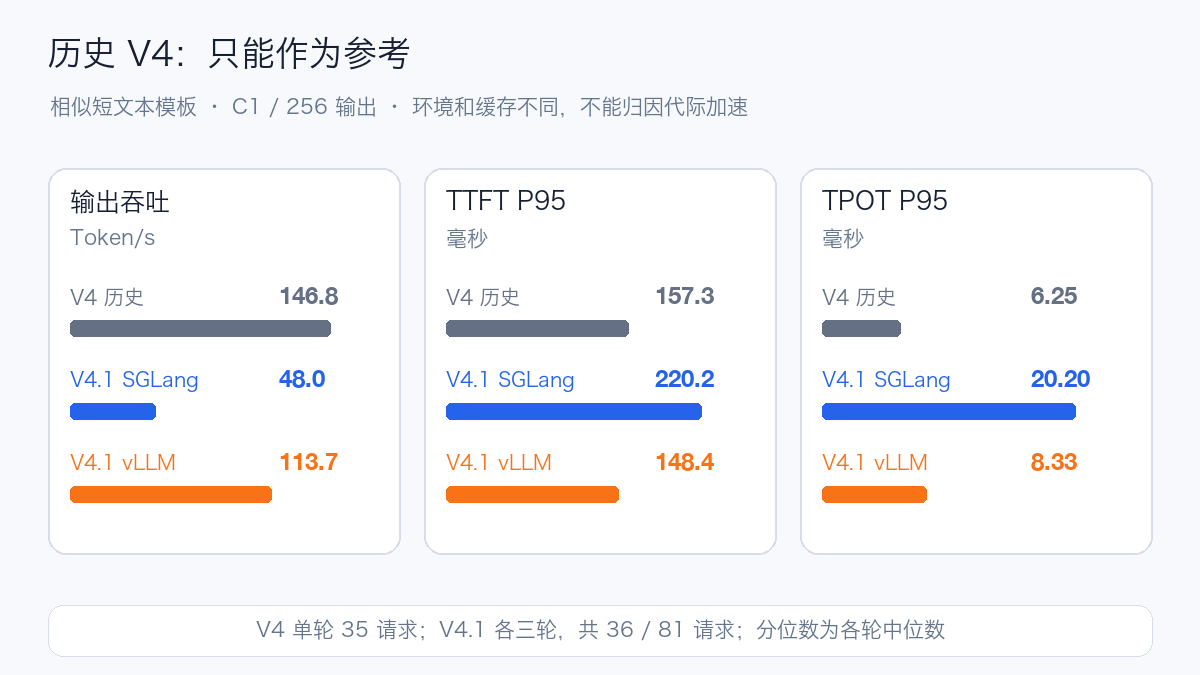
| Deployment record | Samples / Rounds | Output Tokens/s | TTFT P95 ms | TPOT P95 ms |
|---|---|---|---|---|
| Historical V4 / vLLM | 35 / 1 | 146.779 | 157.260 | 6.249 |
| V4.1 / SGLang | 36 / 3 | 48.027 | 220.198 | 20.203 |
| V4.1 / vLLM | 81 / 3 | 113.724 | 148.442 | 8.328 |
This round reused the short-text template, C1 closed loop, and 256 outputs, with SGLang input ranges of 535–542 tokens and vLLM 534–544 tokens; the old requests carried random UUIDs and were not verbatim replays. The historical table uses a client that retains the old timing method, separate from the strict client used for the core matrix. New data remains the median of per-round metrics; the old data has only one round, so historical variance cannot be reconstructed.
The old deployment used vLLM 0.26.0b2.dev1+g3b102b576, CUDA 12.9, FP8 KV, and prefix caching enabled; the current setup uses a different model, engine build, CUDA 13, and native KV path, with text prefix caching disabled. The old scenario used an eight-GPU engine to process requests, but the entire experiment reserved sixteen GPUs. The earlier historical length data with 96 GB H20 plus DSpark also does not constitute a same-hardware comparison.
This round's vLLM TTFT is slightly lower than this historical point, but throughput and TPOT did not improve correspondingly; this cannot prove that V4.1 is universally faster, nor can it be used to assert a regression in model architecture. The official global KV compression ratio describes state size, not a local throughput speedup multiplier. Historical source: AIBrix and V4 Flash in Practice.
9. Grafana Monitoring and Data Sources
The two dashboards below correspond to the core load-test periods for SGLang and vLLM respectively, running short requests, 8K inputs, long outputs, and 24K inputs in sequence. The time windows differ, and so do the horizontal axis lengths; blue represents SGLang, orange represents vLLM.
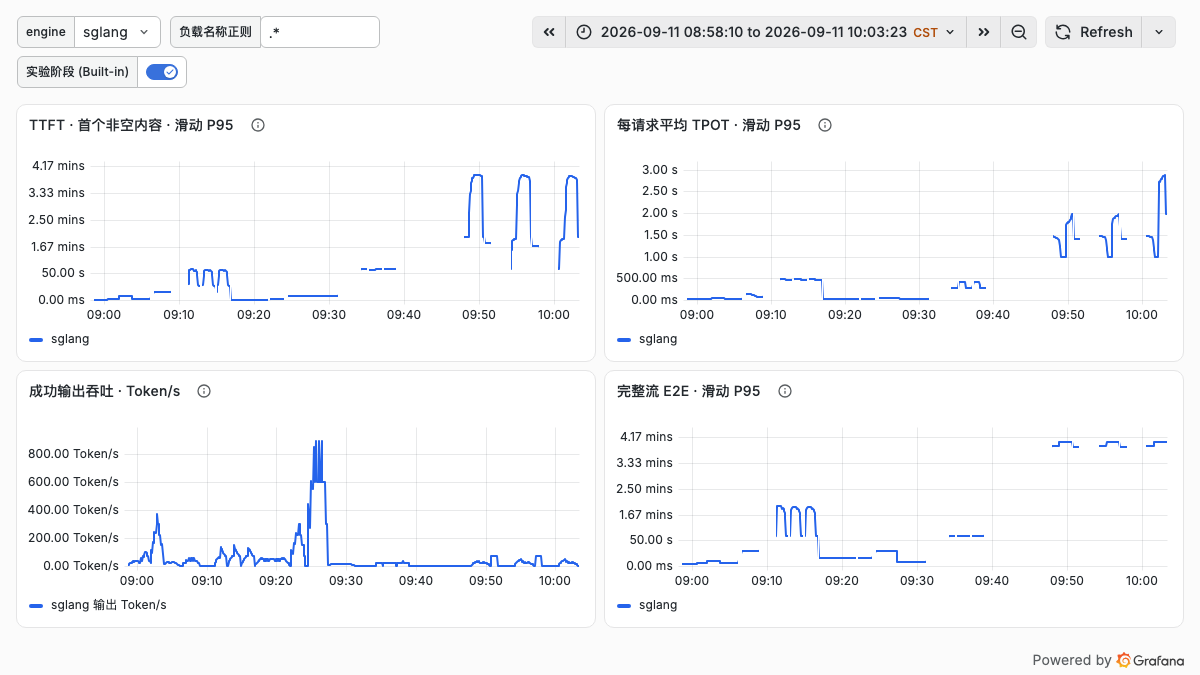
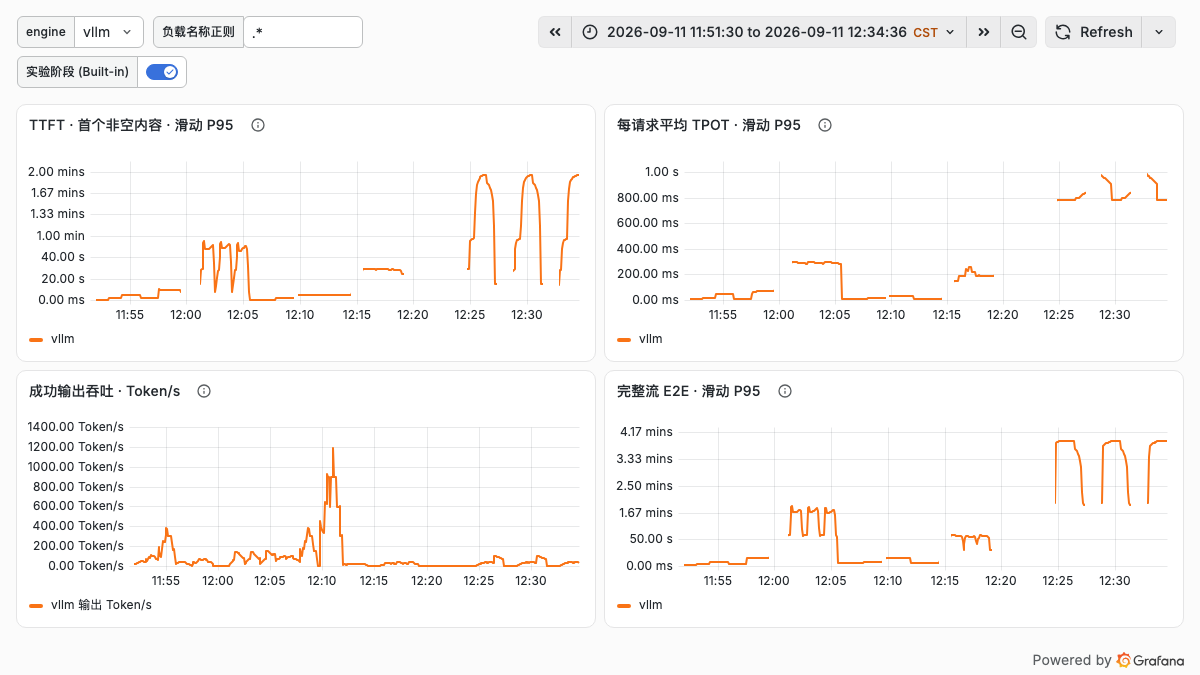
Top-left is TTFT, top-right is per-request average TPOT, bottom-left is successful output throughput, and bottom-right is full-stream E2E. Throughput is higher during the long-output phase; after switching to long inputs, time to first token and full-request latency increase noticeably. Different load phases should be interpreted in conjunction with input/output lengths, and throughput peaks alone should not be taken as service capacity.
The dashboard P95 values come from histogram estimates over a 1-minute sliding window; bucket precision and sample counts both affect the curves. The tables in the main text are whole-round statistics computed from per-request results. Client metrics are written after a request completes, so the curves represent the performance of requests completed in that period; gaps may also come from phase transitions or periods with no completed requests.
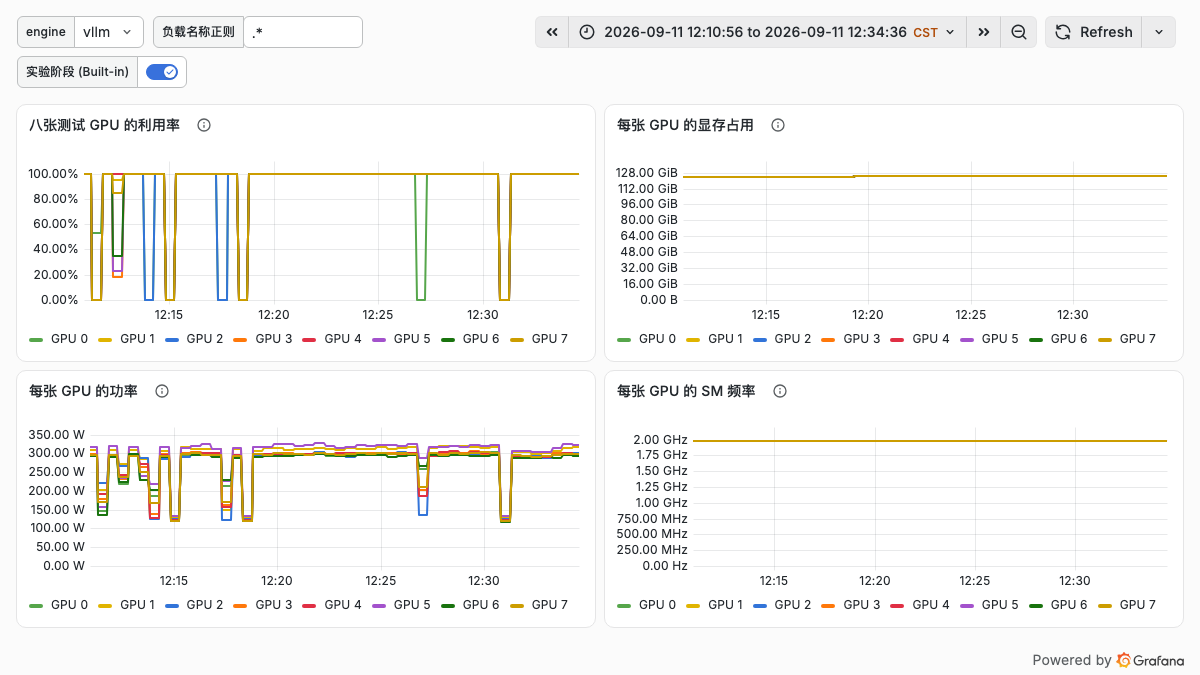
The eight-GPU resource chart corresponds to vLLM's 24K input phase. For samples queried at 15-second intervals, each GPU's memory usage is approximately 123.65–124.67 GiB, with SM frequency at 1.98 GHz; GPU utilization approaches 100% during high-load intervals and drops during phase transitions. The memory here includes weights, KV, and runtime allocations, and should not be treated as model weight size, nor is it a per-millisecond captured peak.
Dashboard screenshots come from Prometheus data retained from the original load-test period; queries, absolute time windows, and data point checks are in the monitoring evidence notes. The screenshots use a light layout, and metric queries retain their original semantics.
Functional conclusions come from API responses and raw SSE; this document does not provide OpenWebUI conversation screenshots. Monitoring curves can locate phase changes but cannot independently distinguish the contributions of operator execution, communication, and queuing; such attribution still requires profiling. The test scope is limited to single-node GPU Engram and inputs up to 24K tokens, and does not cover CPU offload, 1M context, DSpark, bounded replay, multi-machine scaling, or long-term stability.
10. Image Build and Dependency Checks
| Issue | Confirmed Cause | Handling and Verification |
|---|---|---|
Read-only check Pod stuck in ContainerCreating, event node has not turbo kernel mod |
Scheduled to a CPU node without the CFS Turbo kernel module installed | Rescheduled to a node with that mount capability, keeping GPU requests at 0; after the Pod started, it successfully read the shared directory. In production, storage capability labels should be maintained, and node selection should not be based solely on CPU/GPU classification |
Source preparation reported --filter can only be used when extensions.partialClone is set |
The older Git version in the relay environment had additional requirements for certain clone configurations | After adding the corresponding remote and partialClone configurations, the fixed commit was fetched and confirmed, and image build proceeded. The long-term approach is to pin the build toolchain version |
| vLLM build waiting for FlashInfer distribution cache lock timeout | Two build stages shared the uv cache, and a large package download held the lock beyond the other stage's 300-second wait limit | Added sharing=locked to the dedicated build Dockerfile for the shared uv cache mount so BuildKit serializes use of that cache; without changing model or runtime source code, the build continued to completion |
| Wheel size check failed after CUDA compilation completed | The generated wheel was 567.79 MB, exceeding the upstream packaging check threshold of 500 MB; this was not a CUDA compilation failure | The internal container build used the upstream RUN_WHEEL_CHECK=false parameter, retaining full kernels and failure logs, and reused the build cache to complete the image. Dependency, GPU kernel, and model functionality checks still need to be performed separately |
| Sync interface showed completion, but the model still could not load | The actual target CFS was still missing weight shards; the interface status and the mount directory are not the same readiness evidence | Used a zero-GPU container to check actual file sizes, Safetensors headers, and full SHA-256; only after passing did we request eight GPUs |
Zero-GPU client running vllm --version failed |
This candidate's global entry point triggers device type inference when constructing service parameters; this does not mean the CPU load-test entry point is unusable | Recorded the version from package metadata and actually executed vllm bench serve against a local simulated SSE service; two simulated requests completed, proving only the client CLI and transport path, and are not counted toward model results |
Dependency checks also retained failing items: the SGLang image has NCCL, protobuf, and some optional multimodal dependency conflicts; vLLM's Torch metadata requires NCCL 2.29.7, while 2.30.7 is actually installed and loaded. The dependency conflicts have not been resolved and must be evaluated separately from the GPU numerical checks and functional results that passed.
11. Recommendations for Deployers
Concurrency should be determined by the business latency target. This round's 24K/C32 TTFT P95 exceeded one hundred seconds; online services need lower concurrency and explicit queueing limits for long-text requests. Evaluate capacity for short and long requests separately, combined with timeouts and admission control, to avoid long prefill slowing down interactive requests.
Check GPU communication, CPU scheduling, and memory placement separately. The local NV18 GPU interconnect and two NUMA domains coexist on this machine; the CPU set allowed for a process does not equal the actual physical page location. In production, verify with device topology, CPU Manager, Topology Manager, and actual core-pinning policies; when a single eight-GPU Pod spans two NUMA domains, policies that require all resources to fall within a single NUMA domain should not be enabled without verification. CPU Engram in particular requires independent measurement of local/remote memory and PCIe access costs.
Deployment admission should require valid content, end markers, and token usage information simultaneously, not just an HTTP 200 check. Pin versions and record startup parameters and dependency differences; for this vLLM build with the empty-text anomaly, do not commit production capacity based on the charted throughput before real-business validation. SGLang also has disconnection samples and notably long-input tail latency, so stability cannot be declared qualified based solely on the core matrix passing.
When evaluating capacity, observe effective request throughput, TTFT, TPOT, and failure rate simultaneously, and perform replay using the actual business input/output distribution.