Optimizing Kubernetes Clusters at 10,000 Nodes: Control Plane, etcd, Scheduling, and Networking
When discussing Kubernetes at 10,000 nodes, the most common mistake is to start by looking for a "universal parameter table." As node scale grows, what actually brings down the system is usually not the node objects themselves, but the control loops formed by Lease, Pod, Event, CRD status, LIST/WATCH, scheduling retries, and batch changes. With the same 10,000 nodes, running "one machine per large job" versus "one hundred microservice Pods per machine" can differ by orders of magnitude in control plane load.
My processing order has always been: first decide whether a single cluster is worth it, then build a load model, then reduce invalid requests, and only last tune component parameters. If a cluster only maintains superficial stability by increasing client QPS, expanding etcd quota, and lengthening timeouts, further scale growth will only push failures to positions that are harder to recover from.
Let me start with several conclusions:
- The currently published general scale baseline from Kubernetes upstream is at most 5,000 nodes, 110 Pods per node, 150,000 Pods total, and 300,000 containers. This is a validated working range, not a hard limit written into the code. Kubernetes best practices for large clusters
- Ten thousand nodes already exceeds the upstream general validation boundary. It is achievable, but requires dedicated scale testing, controlled workload patterns, etcd and API governance, clear failure recovery capabilities, and acceptance of a larger single-cluster failure radius.
- etcd optimization is first about reducing objects and writes, not swapping in a set of magic parameters. Raft writes must wait for a majority; adding members only improves fault tolerance, not write capacity.
- A single ultra-large cluster is not a trophy for platform maturity. For ordinary workloads, multiple clusters of controlled scale are often easier to upgrade and isolate failures; for large jobs that need to share an entire GPU pool with relatively few Pods, a single large cluster may produce sufficient capacity gains.
This article focuses on the engineering methods for scaling up a single cluster. For release, configuration, and disaster recovery governance across hundreds of independent clusters, continue reading Stability engineering for hundreds of Kubernetes clusters.
Specific configurations, metrics, and technology selection for scheduling and monitoring are covered separately in Large-scale Kubernetes scheduler optimization and Large-scale Kubernetes monitoring and time-series database selection.
1. Node count is not a capacity model
Kubernetes nodes update Lease every 10 seconds by default. At 10,000 nodes, heartbeats alone generate roughly 1,000 Lease updates/second; this does not yet account for Pod lifecycle, Events, controller status updates, and business CRDs. Node status itself is updated by default on change or every 5 minutes; Lease is the high-frequency health signal. Node heartbeat
I start by writing the scale as the following pressure bill:
English rendering — the original text is retained below.
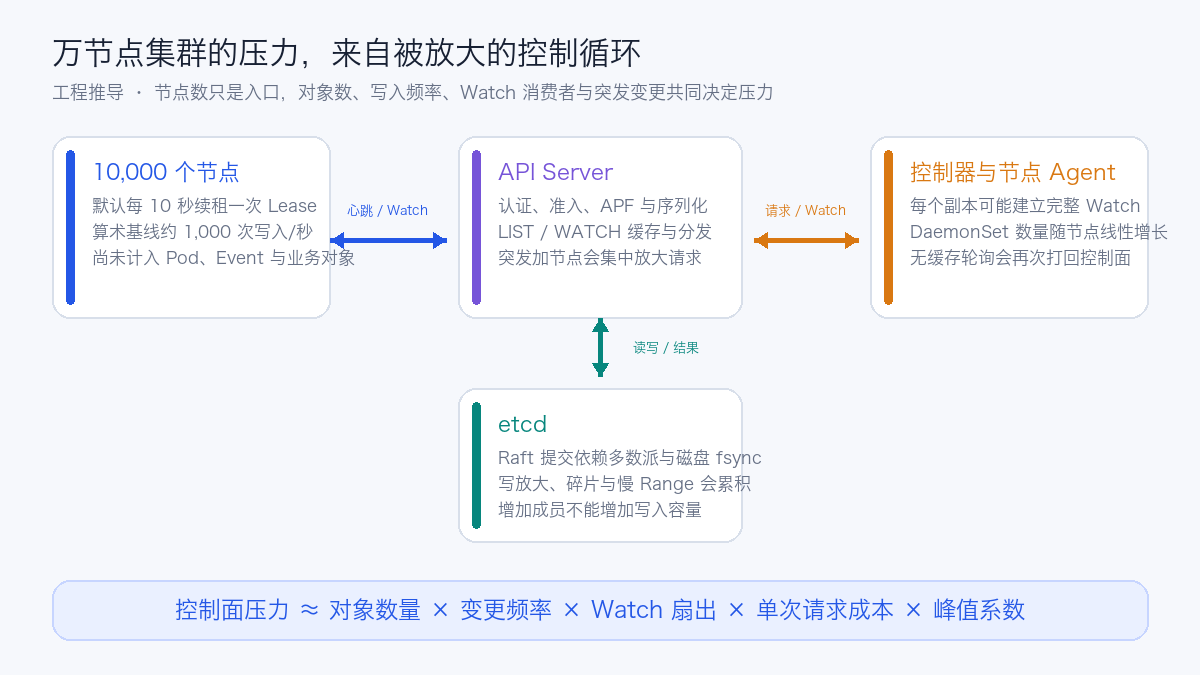
This model explains many seemingly inconsistent phenomena: the node count does not change, but merely adding one Agent running on every node causes API Server traffic to rise noticeably; the workload count stays the same, but expanding controller replicas from 2 to 20 causes each replica's full Watch to amplify network and deserialization costs tenfold; the etcd file is only a few GB, yet a single Range request returning a large number of objects can still cause tail latency and memory to spike suddenly.
During scale reviews, I at least collect the following data rather than just filling in "target 10,000 nodes":
| Dimension | Values to measure | Why it matters |
|---|---|---|
| Object base | Counts of Node, Pod, Lease, Event, Service, EndpointSlice, Secret, ConfigMap, and major CRDs | Determines storage, LIST, and Watch initial sync costs |
| Writes | CREATE, UPDATE, PATCH, DELETE rates and peaks per resource | Determines etcd Raft, admission, and serialization pressure |
| Reads | LIST response size, scope, frequency, and pagination behavior | Large-scope reads easily cause API Server and etcd memory spikes |
| Watch | Connections, event rates, and slow consumers per resource | The same change is processed repeatedly by multiple consumers |
| Scheduling | Pending Pods, creation rate per second, scheduling latency, failed plugins, and retry volume | Determines whether the bottleneck is in filtering, scoring, queue, or backend capacity |
| Change peaks | Request curves after node additions, controller restarts, batch releases, and zone failures | Steady-state normality does not mean the recovery process can withstand it |
2. Ten thousand nodes should be an architectural choice
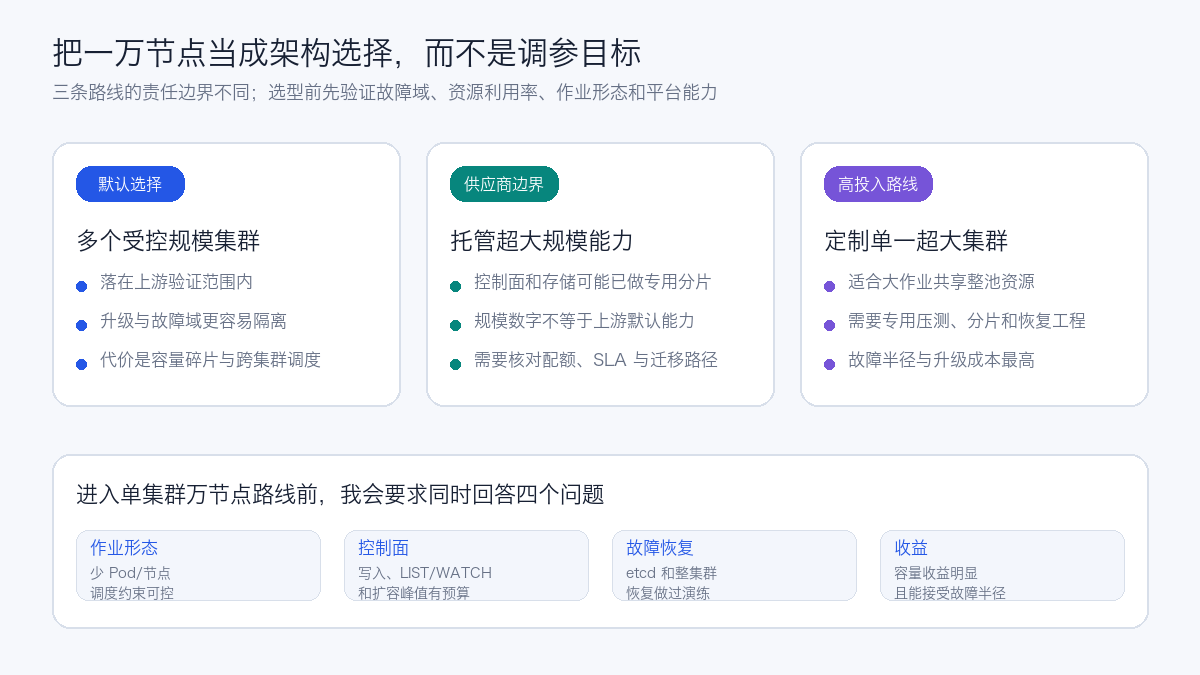
I typically compare three routes first:
| Route | More suitable when | Main costs |
|---|---|---|
| Multiple clusters within validation boundaries | Ordinary online services, multi-tenant isolation, independent upgrade windows, zone failure domains | Capacity fragmentation, cross-cluster scheduling, configuration and version governance |
| Cloud provider managed ultra-large-scale capability | Wanting to purchase an already customized control plane, able to accept product boundaries | Vendor dependency, quota and feature differences, migration costs |
| Self-built single 10,000-node cluster | Few Pods per node, large jobs sharing resources, benefits covering engineering costs | Single-cluster failure radius, dedicated storage and control plane, upgrade and recovery complexity |
OpenAI has publicly shared a 7,500-node cluster, but the article also states that its workloads typically occupy an entire machine with one Pod, scheduling constraints are relatively simple, and the network has strong guarantees. This workload pattern is not equivalent to running many microservices per node. Their Endpoints Watch fan-out once produced traffic approaching N²; after switching to EndpointSlice, the related load dropped by three orders of magnitude. Adding several hundred nodes at once also impacts the API Server, so scaling must proceed smoothly. OpenAI: Scaling Kubernetes to 7,500 Nodes
Uber's public migration practice validated a scenario of 7,500 nodes, 200,000 Pods, and 150 Pods scheduled per second, and adjusted client QPS, controller concurrency, scheduler, and APF. Uber chose larger clusters to reduce resource fragmentation and control plane overhead; this benefit premise is equally important. Uber: Migrating the Compute Platform to Kubernetes
AWS EKS's Ultra-Scale capability reaches 100,000 nodes, but it partitions Kubernetes objects across multiple etcd clusters by resource type and uses dedicated scheduling and control plane implementations. This case proves that "ultra-large scale requires sharding," and cannot conversely prove that upstream default components can reach the same numbers without modification. Amazon EKS Ultra-Scale architecture
Putting these cases together, my judgment is: first confirm how much real fragmentation a super-large cluster can reduce, then decide whether to bear a larger recovery unit. If the benefit comes only from "a bigger cluster number," multi-cluster is usually the safer choice.
3. Extracting operational experience from Alibaba and ByteDance public practices
International cases show how large ultra-large clusters can be; Alibaba and ByteDance's sharing is closer to daily operations: why one API Server gets saturated after a control plane rolling upgrade, why Controller primary/backup switchover still takes minutes, why one DaemonSet Agent can bring down an entire cluster, and why metadata pressure suddenly amplifies after offline workloads enter.
A version boundary needs to be stated here first. Alibaba's 10,000-node control plane article comes from 2019, and some improvements have since entered upstream Kubernetes; ByteDance's 20,000-node sharing comes from 2024, where KubeGateway, KubeBrain, and the Gödel Scheduler are deeply customized solutions. My approach is not to copy the patches from those years, but to reduce them back to problems that still hold today, then choose what the current version can provide.
3.1 Load testing must reproduce object patterns and restart processes
In its 10,000-node planning, Alibaba used 10,000 Nodes, 200,000 Pods, and 1 million objects as the target model, and used Kubemark to simulate 10,000 kubelets. In initial tests, Pod scheduling latency reached the 10-second order of magnitude, along with etcd read/write latency, Pod/Node queries potentially causing backend OOM, Controller restart recovery taking minutes, and insufficient scheduling throughput. Alibaba: optimizing the control plane for 10,000-node Kubernetes
The value of these numbers is not in providing a fixed specification, but in reminding me: nodes, Pods, and objects must be modeled separately. Ten thousand nearly idle simulated nodes cannot represent ten thousand production nodes running large numbers of CRDs, Webhooks, and Agents. My scale testing is split into three load profiles:
| Profile | What to reproduce | Key evidence |
|---|---|---|
| Steady-state objects | Counts and sizes of Node, Pod, Lease, Service, EndpointSlice, Secret, and major CRDs | API/etcd memory, LIST sizes, Watch event rates |
| Business changes | Releases, elasticity, batch Job creation, status updates, Events, and deletions | Write QPS, scheduling throughput, queue backlog, Webhook latency |
| Cold start and recovery | API Server, Controller, Scheduler, Agent, and batch node reconnection | LIST storms, cache sync time, peak memory, time to recover to SLO |
Ant Group's sharing further points out that standard load testing easily misses production extensions: a non-conformant DaemonSet client or slow Webhook is enough to push the API Server toward crash in a 10,000-node environment. Ant Group: 10,000-node cluster practice Therefore, the load test package must include production DaemonSets, Operators, Webhooks, auditing, and monitoring pipelines; testing only the native control plane at most proves that the upstream baseline can run.
3.2 Four-layer load balancing cannot solve long-connection skew
Both Alibaba and ByteDance encountered load imbalance across multiple API Server instances. client-go reuses HTTP/2/TLS long connections; after an API Server rolling upgrade or single-instance restart, the instance that recovers first may take on a large number of long-lived connections, while instances that recover later receive far fewer requests for a long time. A normal four-layer LB only selects a backend at connection establishment; if connections are not re-established, adding more LBs will not redistribute existing traffic.
I first confirm the problem from four sets of metrics before deciding whether to introduce a gateway:
- Compare request rate, CPU, memory, inflight, and Watch count per instance;
- Compare frontend connection count, HTTP/2 stream count, and client sources;
- Align the start time of imbalance with API Server rollout, failures, and certificate updates;
- Cross-reference business verb/resource to distinguish skew from a few large LISTs versus ordinary request count.
The short-term measure is a scale-out-before-scale-in API Server release strategy: let new instances become Ready and complete cache warm-up before taking down old instances, while limiting the number of instances exiting at once. When request-level balancing is needed long-term, a seven-layer Kubernetes API Gateway can be evaluated. ByteDance's open-source KubeGateway can parse request attributes such as user, verb, and resource, performing routing, rate limiting, degradation, and upstream health checks at the HTTP request layer, and converging upstream connections through HTTP/2 multiplexing. ByteDance GOPS sharing at 20,000 nodes
Once an API Gateway enters the control plane, it becomes a new critical dependency. The rollout gate must cover long Watch, exec/log streaming connections, certificates and Impersonation, audit identity, Gateway failure bypass, and connection migration during upgrades. If a complex gateway is introduced merely to fix one connection-skew incident, the added risk may outweigh the benefit. For the specific trade-offs among four-layer, seven-layer, TLS termination, and GOAWAY, continue reading Kube-apiserver load balancing in practice.
3.3 HA process readiness does not mean the control loop is ready
A Controller or Scheduler standby instance may be in a running state, but its Informer cache may not yet be synchronized; if the primary fails and a cold standby performs a full LIST and deserialization, the switchover still takes minutes and adds load to the API Server and etcd at the most fragile moment.
Alibaba's approach was to start the standby instance's Informers in advance, and when the primary upgrades, proactively release the Leader Lease so the already-warmed standby can take over. Its sharing reported switchover interruption dropping to under 2 seconds during upgrades, while abnormal failures mainly wait for the default 15-second Leader Lease to expire; this was the result in the target environment at the time and cannot be directly treated as an SLO for other clusters. Alibaba Controller failover practice
In my own platform, I split controller readiness into four items: process liveness, key Informer HasSynced, local resourceVersion close to API Server progress, and representative queues able to advance after leadership is acquired. Hot standby increases Watch and memory, so it is only used for critical controllers, and the duplicate cache of primary/standby replicas is counted into capacity.
The API Server needs a similar gate. ByteDance shared rejecting large LISTs when Cache is NotReady, and steering qualifying reads to cache, with the goal of preventing a cold instance from accepting the most expensive full reads while still initializing its cache. Current versions can also combine WatchList, consistent reads from cache, and etcd RangeStream, but the core rule has not changed: before cache synchronization completes, do not let the instance take on the most expensive traffic.
3.4 The evolution order of metadata storage matters more than the final architecture
Alibaba's etcd approach went through multiple rounds of evolution: external storage, splitting multiple etcd clusters by resource, and then locating bbolt page allocation problems. The first version introduced Tair to increase capacity but added operational complexity and changed consistency risk; only later did it continue through resource routing and underlying storage optimization. This process reminds me that replacing the storage backend expands a "capacity problem" into "consistency, Watch, backup, and upgrade problems."
After offline workloads entered, ByteDance observed 10 to 20 times the metadata storage pressure, then built KubeBrain to adapt the MVCC, CAS, and Watch semantics required by Kubernetes to distributed KV backends such as ByteKV; the public case reported results of 10,000 nodes, over 400,000 containers, and Gang scheduling of 5,000 containers within 10 seconds. ByteDance colocation scheduling practice KubeBrain also explicitly sets horizontal scaling as a goal.
I do not interpret this as "10,000 nodes must replace etcd." The implementation order remains: govern writes and large objects → dedicated hardware → cache/list/watch optimization → Event or hot-resource splitting → evaluate custom storage. When reaching the last step, the acceptance scope at least includes:
- Linearizable reads, CAS, and transaction boundaries;
- resourceVersion monotonicity, Watch ordering, resume-after-disconnect, and history compaction;
- TTL/Lease, pagination, large objects, and slow consumers;
- Fault injection, network partitions, primary/backup switchover, and indeterminate write results;
- Snapshots, cross-version upgrades, rollback, data validation, and full-chain Kubernetes recovery.
The TODO list publicized in the KubeBrain repository still includes consistency-critical scenarios, Jepsen tests, and similar work. This information matters: an open source project demonstrating an architectural direction does not mean any version can directly replace production etcd. When making a selection, you must verify the commit in use, the backend, and the tests already completed; you cannot rely only on peak numbers cited in a talk.
3.5 Scheduling throughput comes from reducing duplicate work
The two ideas shared by Alibaba are grouping similar Pending Pods into equivalence classes and reusing filtering and scoring results; when there are many candidate nodes, use relaxed randomization and stop scanning once enough feasible nodes are found. ByteDance's open source Gödel Scheduler instead uses optimistic concurrency to optimize filtering and scoring, and introduces Unit/Pod two-level semantics to handle batch jobs and Gang Scheduling.
These practices keep me from first increasing scheduler concurrency parameters. A more effective order is usually: identify batches of Pods with identical constraints → cache or reuse duplicate computations → reduce re-queueing caused by unrelated events → use a lighter profile for simple workloads → reduce candidate nodes at an acceptable placement quality → adjust concurrency last. Each step must consider both throughput and fragmentation, to avoid tuning for short-term speed while carving up large available resource blocks over the long term.
3.6 Very large clusters need the ability to stop correct programs from taking wrong-scale actions
Alibaba ASI's operations retrospective disclosed several representative incidents: a normal Kubelet upgrade caused nearly a thousand business Pod rebuilds, a misjudgment triggered business eviction across more than 300 nodes, and non-standard operations deleted services in bulk. The subsequent solution set operation tokens for critical resources such as Pod, Service, and Node at 1 minute, 5 minutes, 1 hour, and 24 hours, combined with UserAgent rate limiting and APF, and used continuous probes to participate in release blocking. Alibaba ASI fully managed operations practice
This kind of experience is closer to the core of ten-thousand-node stability than "deploy a few more monitoring systems." My automated workflows set up all of the following at the same time:
- Object budget: limits the number of Nodes/Pods/Services that can be deleted, evicted, or updated in one operation and within one window;
- Failure domain budget: constrains clusters, availability zones, node pools, and the same business replica group separately;
- Caller budget: counts and rate-limits by ServiceAccount/UserAgent, verb, and resource;
- Progress gate: business probes, control plane metrics, and observation completeness must all be satisfied before expanding a batch;
- Independent brake: stops new actions when there is abnormal expansion, lost metrics, or unclear execution state;
- Stateful confirmation: databases, middleware, Flink, and training workloads provide interruptibility conditions to the platform; the self-healing system does not guess on its own.
I put these lessons into a troubleshooting table rather than keeping them as architecture vocabulary:
| On-site symptom | Easy first reaction | Evidence I check first | Priority action |
|---|---|---|---|
| One API Server is saturated while other instances are idle | Add more instances | Per-instance connections, streams, request rates, and rollout timeline | Scale out then scale in, connection/request-level rebalancing, then evaluate the L7 gateway |
| Continuous OOM after control plane restart | Keep adding memory | Cache ready, full LIST, resourceVersion, client retries | Cold-start rate limiting, cache sync gate, staggered restarts |
| Controller failover takes minutes | Shorten Leader Lease | Informer sync and deserialization time, queue recovery | Pre-warm critical controllers as hot standby, then adjust Lease |
| etcd DB and write latency keep growing | Increase quota | Top N writers, object size, history and fragmentation rate | Govern status/Event, compact/defrag, split by resource if necessary |
| Scheduler throughput insufficient | Increase concurrency | Plugin latency, duplicate constraints, ineffective retries, fragmentation | Reuse computation, split profiles, reduce candidate nodes |
| One self-healing action affects hundreds of nodes | Add more judgment rules | Action window, failure domain, business replicas, and stop conditions | Multi-layer operation budgets, probe gates, and independent circuit breaking |
4. Establish service objectives for the control plane first
Optimization must center on user-perceivable results. Looking only at CPU utilization makes it easy to miss queueing, rejection, and client retries. I divide control plane objectives into four layers:
| Layer | What to observe | Example criteria |
|---|---|---|
| API availability | Success rate, 429, 5xx, inflight, APF queueing and rejection | Critical writes meet SLO within the target window; rate limiting protects core requests |
| API responsiveness | P50/P95/P99 by verb/resource/scope | Large LISTs are measured separately and not averaged together with small GETs |
| Reconciliation progress | workqueue depth, retries, oldest pending item, controller latency | After a request succeeds, the target object reaches the desired state within the specified time |
| Business outcomes | Pod scheduling, startup, Service reachability, volume mounting, DNS resolution | Batch scaling and failure recovery still meet acceptance criteria |
Before scale testing, pin the version, feature gates, and client configuration, and save the resources and parameters of API Server, scheduler, controller-manager, etcd, CNI, CSI, DNS, and critical controllers. Otherwise a test conclusion cannot be explained and cannot be used for upgrade regression.
5. API Server: govern clients first, then add instances
Adding API Server instances can spread stateless requests and Watch connections, but it cannot eliminate issues such as writes ultimately landing in etcd, every controller repeatedly Watching, or Webhook serial blocking. I handle these in the following order.
5.1 Give LIST/WATCH boundaries
- Controllers use shared informers/caches and avoid direct LIST on every reconciliation; cache only the resources, Namespaces, and fields needed.
- Use backoff on WATCH disconnects and allow
BOOKMARK; do not let all clients perform a full LIST at the same second. - When an initial state is needed, use the streaming list/watch mechanism supported by the target version to avoid fully caching a huge list in API Server memory. In Kubernetes 1.34, Streaming Lists entered Beta and are enabled by default; still verify per client and version before use. Streaming Lists
- For requests where read-only consistency requirements permit, validate the watch cache path. Kubernetes reported in 5000-node tests that consistent reads from cache reduced API Server CPU by about 30% and etcd CPU by about 25%; this is a result from that test environment and must be re-measured on your own object distribution. Consistent Reads from Cache
The cache in controller-runtime hides LIST/WATCH costs. An ordinary-looking List() in a Reconcile, if not scoped, can load all objects of a resource type into process memory. Before scaling controller replicas, measure the number of cached objects, memory, and Watch traffic per replica, rather than looking only at Reconcile concurrency. Controller-runtime cache documentation
5.2 Use APF to protect critical control loops
API Priority and Fairness can classify requests by user, ServiceAccount, verb, resource, and Namespace, isolate concurrency shares, and queue some requests. It is suitable for preventing bulk LISTs, platform scripts, or misbehaving controllers from crowding out kubelet and core controller requests, but the configuration must be validated through hit verification and load testing. APF official documentation
My approach is to first identify the dominant request sources from audit logs and metrics, then establish a small number of clear priorities: node heartbeat and core controllers, production changes, ordinary platform requests, and batch/debug traffic. Then verify actual effects through response headers, FlowSchema hit counts, queueing time, and 429s. This site's APF isolation field test demonstrates this verification method.
APF does not reduce the cost of one huge LIST itself, nor does it protect against bad writes that have already reached etcd. If rate-limited clients retry without backoff, they can generate even more traffic, so client request budgets and server-side policies must be changed together.
5.3 Shorten the admission path
Every admission Webhook call sits on the critical path of API writes. Narrow the matched resources and Namespaces, use matchConditions to exclude objects that do not need processing, set short and explicit timeouts, provide multiple replicas and anti-affinity, and avoid Webhooks modifying objects they depend on, which creates loops. For simple validation, prefer built-in capabilities such as CEL. Admission Webhook best practices
failurePolicy cannot be uniformly set to Ignore or Fail: security boundaries usually require fail-closed, while availability-assisting capabilities may allow fail-open. The decision should be written into the threat model and failure drills, not switched on the fly during an incident.
5.4 Make node joins and component restarts batched
Node startup generates a chain of requests: registration, Lease, status, DaemonSet Pods, CNI/CSI, and monitoring agents. Bringing in hundreds or thousands of nodes at once makes all control loops accelerate simultaneously. The join process needs a fixed number of nodes per batch, an observation interval between batches, and automatic stop conditions; DaemonSet rollouts, controller restarts, and node scaling should also avoid overlapping in the same window.
6. etcd: optimize the write path and recovery capability
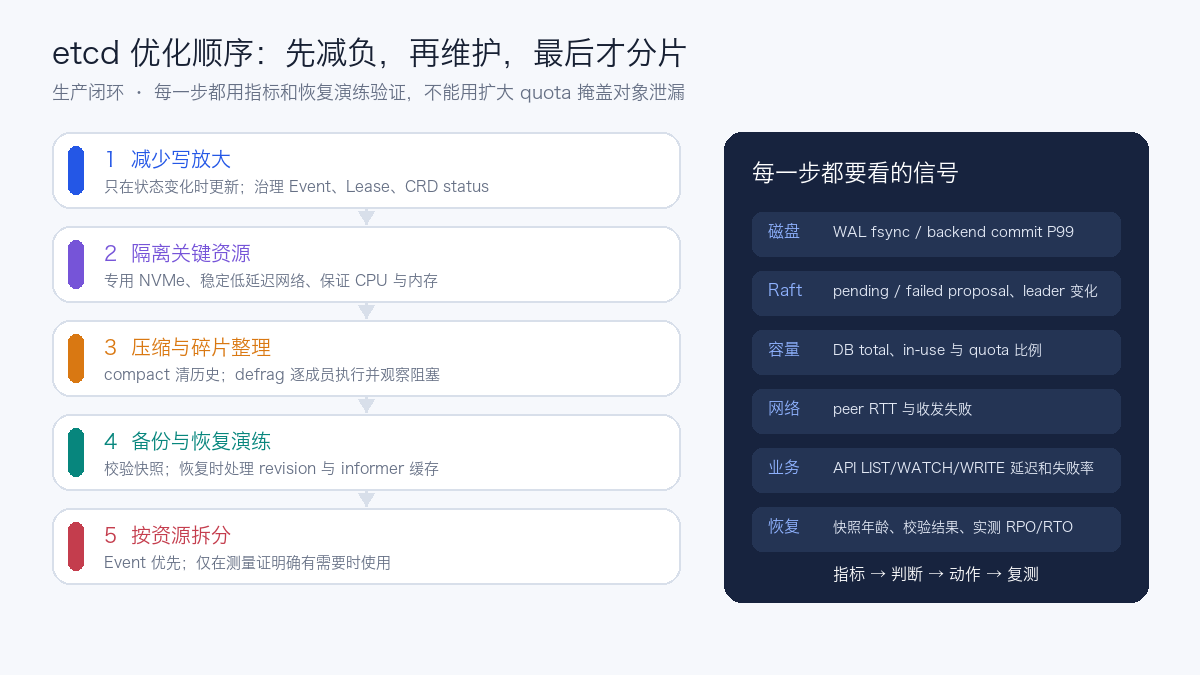
etcd is the foundation of Kubernetes consistent state. A single write must enter the WAL, commit through a Raft majority, and then be applied to the backend storage. Disk jitter, inter-member network latency, CPU starvation, or large-scale reads can all surface as API Server tail latency. My optimization principle is to reduce the load first, then guarantee hardware, then maintain the database, and only consider splitting last.
6.1 First find out who is writing
Before expanding disk and quota, first count writes from API Server metrics and audit logs by resource, verb, user, and userAgent. Common problems include:
- Controllers update
statusregardless of whether the state changed; - Events repeat at high frequency, or retention is far longer than troubleshooting requires;
- Agents PATCH objects on a timer, using Kubernetes as a metrics or heartbeat database;
- CRD objects are too large, with logs, history, or large configuration blocks stored in status;
- Failed control loops keep creating, deleting, or updating objects;
- Invalid finalizers leave deleted objects stranded for a long time.
Addressing these sources is usually more effective than tuning etcd parameters. Status updates should compare old and new values and write only on change; high-frequency time-series data goes into the monitoring system; history records go to object storage or a database; Events get a TTL matching the troubleshooting window; CRDs separate frequently changing fields from long-lived configuration.
6.2 Give etcd dedicated, predictable resources
etcd is highly sensitive to persistence latency. I prefer dedicated local NVMe/SSD, avoiding shared I/O with logs, container images, and high-throughput workloads; reserve CPU and memory for the process and disable swap; choose low-latency, low-loss paths for inter-member networking, and use consistent heartbeat and election parameters across all members. etcd tuning
Heartbeat should not be guessed. etcd recommends setting it to roughly 0.5 to 1.5 times the inter-member RTT, election timeout at least 10 times the RTT, and all members using the same values. Lengthening election timeout reduces spurious elections but delays real failure detection; fix disk and network jitter first, then adjust timing parameters.
Choose 3 or 5 members based on the failure model. Increasing to 7 members does not improve write throughput, because a commit still waits for a majority, and it only increases replication and quorum-reaching costs. Members should not be auto-scaled; cross-region deployment must also put RTT and simultaneous regional failure risk into testing. Kubernetes configuring external etcd
Key parameters should be managed together with version, rationale, and verification results:
| Parameter | Purpose | Production adjustment basis |
|---|---|---|
--heartbeat-interval |
Interval at which the leader sends heartbeats to followers | Inter-member RTT, disk tail latency, and spurious election records |
--election-timeout |
Time a follower waits before declaring the leader failed | Proportional to heartbeat; trade off spurious elections against failure detection time |
--auto-compaction-mode / --auto-compaction-retention |
Retain MVCC history by time or revision | Slowest Watch recovery window, write rate, and database growth rate |
--snapshot-count |
Number of committed transactions that triggers an internal Raft snapshot | Memory, slow follower catch-up, and snapshot overhead; it is not a disaster-recovery snapshot |
--quota-backend-bytes |
Space alarm triggered when the backend reaches quota | Object scale, growth rate, handling time, and measured recovery capability |
--max-request-bytes |
Maximum size of a single etcd request | Prefer splitting Kubernetes objects into smaller ones; raising the limit requires evaluating memory and tail latency |
etcd 3.6 lowered the default of snapshot-count from 100,000 to 10,000 to reduce retained Raft history and memory; this also shows that copying old configuration across versions loses the new version's default optimizations. etcd 3.6 release notes All members should use the same set of Raft timing parameters, and the precedence among configuration file, command line, and environment variables should be unified to avoid the actually effective values diverging from the configuration repository. etcd 3.6 configuration reference
6.3 Quota is not a capacity expansion solution
The etcd default backend quota is 2 GiB, the official recommended upper limit for regular environments is 8 GiB, and a warning is issued for larger configurations. This number is not a universal answer for ten-thousand-node Kubernetes clusters; it indicates that etcd's design goal remains storing small-scale metadata that fits in memory. etcd system limits
Production quota should be determined by measured object growth rate, compaction period, fragmentation rate, snapshot and recovery time, with headroom reserved for peak handling. Directly raising the limit when the database approaches quota can turn an object leak into a slower recovery. My alerting typically first identifies the growing resource when capacity utilization enters an observation range, then restricts non-critical writes at a higher range; thresholds should be derived from write speed and handling time, not copied as fixed percentages.
6.4 Compaction and defragmentation are two different things
MVCC compaction deletes the logical history of old revisions, reducing the historical range that must be retained; defragmentation rebuilds the backend file and is what returns hole space to the filesystem. Compaction alone does not necessarily reduce the on-disk file size; defragmentation alone cannot govern continuous historical version growth. etcd maintenance
I use the following maintenance procedure:
- Configure automatic compaction consistent with the business recovery objective, and continuously observe compaction-related failures and Watch client behavior;
- Before defrag, confirm the snapshot is valid, the cluster has a leader, members are healthy, and there is no large-scale rollout in progress;
- Process only one follower at a time, observing API latency, leader, pending proposals, and member sync during the operation;
- After verification completes, process the next member, with the leader last, transferring leadership first if necessary;
- Record total size, in-use size, duration, and API tail latency before and after the operation.
Online defrag blocks reads and writes on the target member, so a CronJob must not run it against all members simultaneously. Maintenance frequency should be driven by the fragment growth rate, not by a fixed once-per-day run.
6.5 Complete the etcd Dashboard First
The following metric names come from etcd's stable Prometheus metrics; specific distributions may add labels, so check the target version before querying /metrics.etcd metrics
| Signal | Prometheus Metric | Question to Answer |
|---|---|---|
| WAL flush | etcd_disk_wal_fsync_duration_seconds |
Does P99 show periodic spikes, and do they coincide with API write latency |
| Backend commit | etcd_disk_backend_commit_duration_seconds |
Is BoltDB commit affected by shared disk or defrag |
| Leader | etcd_server_has_leader、etcd_server_leader_changes_seen_total |
Is leadership lost, and is election count growing abnormally |
| Raft backlog | etcd_server_proposals_pending、etcd_server_proposals_failed_total |
Are requests waiting to commit, and are failures related to elections or quorum |
| Database size | etcd_mvcc_db_total_size_in_bytes、etcd_mvcc_db_total_size_in_use_in_bytes |
How much headroom remains before quota, and is the fragment ratio rising continuously |
| Member network | etcd_network_peer_round_trip_time_seconds、peer failure metrics |
Do slow members inflate majority commit time |
A few basic queries can be placed into Grafana first, then supplemented with cluster and member filters based on actual labels:
# WAL fsync P99
histogram_quantile(
  0.99,
  sum by (instance, le) (
    rate(etcd_disk_wal_fsync_duration_seconds_bucket[5m])
  )
)

# backend commit P99
histogram_quantile(
  0.99,
  sum by (instance, le) (
    rate(etcd_disk_backend_commit_duration_seconds_bucket[5m])
  )
)

# 近 15 分钟 leader 变化
sum by (instance) (
  increase(etcd_server_leader_changes_seen_total[15m])
)

# 后端文件中的碎片比例;total 为 0 时需要在面板中保护除零
1 - (
  etcd_mvcc_db_total_size_in_use_in_bytes
  /
  etcd_mvcc_db_total_size_in_bytes
)
The legacy etcd FAQ once gave troubleshooting reference values of WAL fsync P99 below 10 ms and backend commit P99 below 25 ms, but hardware, versions, and load all change. I would treat them as a starting point for detecting slow disks, then establish a baseline from the target cluster's normal-window percentiles and API SLO, rather than writing those two numbers in as immutable production commitments.etcd FAQ disk troubleshooting
6.6 When to Split etcd
The Kubernetes API Server supports routing a specified group/resource to another etcd set via --etcd-servers-overrides. The official large-cluster guide first recommends considering moving Events into a separate etcd, because Events are written frequently and their business recovery value differs from declarative objects.kube-apiserver parameters
Splitting is not the first step. It adds complexity to backup sets, version upgrades, certificates, monitoring, recovery ordering, and consistency troubleshooting. Before adopting it, confirm:
- High-frequency ineffective writes have already been governed, and hardware alone cannot meet the target;
- The target resource can form a clear failure and recovery boundary;
- Every shard has snapshots, recovery, capacity, and alerts;
- API Server parameters, automated installation and upgrade tooling can all stay consistent;
- Recovery drills cover both "one shard lost" and "revision mismatch across multiple shards".
AWS's 100,000-node case distributed resource types across multiple etcd clusters, which is the result of a customized control plane. A self-built cluster cannot simply copy the "multiple etcd sets" layer while ignoring routing, recovery, and operations systems.
6.7 Backup Success Does Not Equal Recovery
Snapshots should at minimum record revision, hash, size, etcd version, encryption configuration, and save time, and integrity checks should be performed with etcdutl snapshot status. Recovery drills must shut down or isolate API Server writes, restore with a matching-version tool, then restart the control plane and complete API, controller, and business acceptance.etcd snapshot
Restoring an old snapshot rolls back the revision, and Informers may still hold "future" state. The etcd 3.6 recovery flow supports revision bump and mark-compacted, used to make Kubernetes clients rebuild their caches; the bump value must be calculated from the possible volume of lost writes and validated in drills.etcd disaster recovery
I would record three times separately: how long to obtain a usable snapshot, how long to restore the API, and how long business coordination takes. Reporting only the etcdutl restore command duration cannot explain cluster RTO.
6.8 What the New Read Optimization Solves
After Kubernetes 1.37 with etcd 3.7, the Beta feature EtcdRangeStream is enabled by default. Traditional unary Range must assemble the full response in etcd memory first; RangeStream adaptively chunks by value size and lets the API Server decode while receiving, reducing memory peaks during watch cache initialization and direct LIST of large resource collections. The following counter can confirm that streaming reads are actually happening:Kubernetes 1.37 RangeStream
RangeStream improves memory behavior for large-range reads and provides no direct help for high-frequency status updates, Events, Leases, slow disks, or Raft commits. Before upgrading, etcd version compatibility, rollback, and scale testing must still be completed; when the metric is zero, check whether etcd has reached 3.7 and whether the API Server actually enabled the corresponding feature gate.
7. Scheduler: Reduce Meaningless Computation, Preserve Placement Quality
Scheduling bottlenecks usually land in one of queue, filtering, scoring, extension points, or external scheduler components. Before optimizing, look at per-plugin latency and failure reasons, paying special attention to topology, affinity, volume binding, and custom extenders. Simple batch and complex online services can use different scheduler profiles to reduce unneeded plugins.
percentageOfNodesToScore allows stopping the search after enough feasible nodes are found. The default algorithm lowers the ratio as the cluster grows, about 10% at 5000 nodes, with a minimum feasible node count. Pushing the ratio lower may improve throughput but sacrifices placement quality, especially when resource fragmentation, topology, and GPU constraints are significant.Scheduler performance tuning
My order is:
- Clean up Pods that can never be scheduled or keep repeatedly re-entering the queue;
- Find the most expensive plugins and constraints with the least value;
- Use mechanisms like QueueingHints to reduce retries triggered by unrelated events;
- Split simple and complex scheduling profiles;
- Finally, adjust scoring ratios and concurrency under a realistic fragmentation model.
Testing scheduling throughput only on an empty cluster masks fragmentation that appears after long-term operation. Load test data must include real node labels, taints, resource distribution, volumes, and topology constraints, and be repeated in the 50% to 80% utilization range.
8. Network and DNS: Control Object Propagation, Not Just Data-Plane Bandwidth
Network problems in very large clusters fall into two categories: whether business packets can be forwarded, and whether network control objects can converge in time. The update speed of Service, EndpointSlice, NetworkPolicy, routes, and DNS records must all be measured.
- Use EndpointSlice, choosing slice size by business and controller capability; the default is at most 100 endpoints per slice, with a configurable maximum of 1000.EndpointSlice
- Evaluate NodeLocal DNSCache to keep repeated queries on the node, estimating memory from real domain distribution and cache hit rate; do not simply allocate by Pod count.NodeLocal DNSCache
- Scale CoreDNS based on node count, Pod count, and actual QPS; validate cache invalidation, rolling upgrades, and upstream DNS failures.
- The kube-proxy nftables backend in Kubernetes 1.33 is stable, and its data structures and incremental updates suit large numbers of Services; before migrating, kernel, CNI, NetworkPolicy, monitoring, and rollback paths must be validated, and iptables may still be the default for existing clusters.nftables kube-proxy
- Pod/Service CIDR, VPC routes, ENI/IP, connection tracking tables, and load balancer quotas must be calculated before cluster creation; retrofitting address space is usually very expensive. The Mobileye 3200-node EKS case also lists VPC, subnet, and IP planning as core constraints.Mobileye EKS scaling practice
DaemonSets are a common amplifier. Ten per-node agents on a 10,000-node cluster means 100,000 Pods; if every agent polls the API Server directly, control-plane pressure grows with node count. Prefer agents reading node-local data, aggregating through layered aggregators, and setting budgets for reporting frequency and failure retries.
9. Approaching 10,000 Nodes with Layered Testing
Production scale cannot be proven by a single full-load test. The test system needs to progress from control-plane simulation toward real nodes:
| Layer | Tool and Environment | What It Proves | What It Cannot Prove |
|---|---|---|---|
| Resource model and controller tests | KWOK, virtual kubelet, or simulated nodes | API, etcd, and controller behavior at large object cardinality | Real kubelet, CNI, CSI, kernel, and node networking |
| Upstream scale load | ClusterLoader2 | API response, Pod startup, scheduling throughput, etcd and resource usage | Business traffic, complex custom controllers, and specific hardware |
| Object churn | kube-burner | Create, delete, update peaks with Prometheus evidence | Node failures and real data-plane capacity |
| Real-node ramp | Target hardware 25% → 50% → 75% → 100% | Full kubelet, CNI, CSI, DNS, and business paths | Uncovered zone-level failures and long-term aging |
ClusterLoader2 is the Kubernetes upstream scale and performance framework; KWOK suits quickly fabricating node and Pod objects; kube-burner suits defining object churn and collecting Prometheus metrics. The three serve different purposes, and simulated-node tests must not be written up as "10,000-node production already passed."
Each level includes at least four scenarios:
- Steady state: target object cardinality and normal business change rate;
- Change: batch releases, DaemonSet rollouts, controller and API Server restarts;
- Elasticity: nodes joining and leaving in batches, and large-scale Pod creation;
- Failure: etcd follower/leader, network jitter, slow disks, DNS, Webhook, and zone capacity reduction.
Stage progression criteria should cover API SLO, etcd disk and Raft, scheduling, Pod startup, DNS/Service convergence, and business probes simultaneously. Missing observability counts as unknown and stops expansion; it is not counted as success.
Cloudflare used KubeVirt to create virtual Kubernetes clusters with hundreds of nodes and thousands of Pods to discover problems that only appear at scale. This approach suits control-plane regression in CI, but real network and node tests are still needed to fill in the boundaries.Cloudflare KubeVirt scale testing
10. An Executable Scaling Cadence
I would break the target scale into "capacity gates" rather than promising to reach 10,000 nodes directly on a specific date. The following ratios are method examples, not universal production parameters:
| Stage | Focus | Evidence That Must Be Kept | Example Stop Condition |
|---|---|---|---|
| Baseline | Current production scale and normal peaks | Component versions, request profile, SLO, etcd and business baselines | Baseline itself unstable or metrics missing |
| 25% target | Object model and client governance | Request Top N, LIST sizes, Watch counts, write resources | New large-range LISTs, etcd disk spikes |
| 50% target | Scheduling, DNS, EndpointSlice, and network convergence | Scheduling percentiles, DNS QPS, Service propagation time | Tail latency persistently exceeding targets, placement quality degrading |
| 75% target | Component rolling and batch node joins | Release timeline, APF, queue and auto-stop records | Retry storms, controller backlog not recovering |
| 100% target | Failure and recovery, long-term churn | etcd recovery, snapshot validation, business RPO/RTO | Cannot recover within target time or failure expands |
Each advance changes only one major variable, and keeps configuration, code versions, raw metrics, and failure samples. Failures in scale experiments are not noise to delete; they are the source of the next stage's gates.
11. Production Checklist
Architecture
- Quantified the resource fragmentation or platform cost reduced by a single cluster, not just node count;
- Compared multi-cluster, managed hyperscale, and self-built single cluster;
- Business can accept the failure radius of a single cluster's control plane, network, and upgrades;
- Pod/node ratio, object count, and change frequency come from the actual load model.
API and Controllers
- Requests and errors counted by user, resource, verb, userAgent;
- Large LISTs have range, pagination, or streaming solutions;
- Controller caches, Watches, and retries have boundaries;
- APF validated through hit and failure experiments;
- Webhooks have timeouts, scope limits, multiple replicas, and explicit failure policies;
- Node joins, DaemonSet rollouts, and controller restarts are executed in batches.
etcd
- Write Top N identified, and unchanged status, Events, and large CRDs governed;
- Low-latency dedicated storage, stable network, and guaranteed CPU/memory in use;
- WAL fsync, backend commit, leader, proposal, DB size, and peer RTT are on the dashboard;
- Compaction and per-member defrag have separate processes;
- Quota comes from growth rate and recovery tests, not used to mask leaks;
- Snapshots validated, and revision bump with business recovery drilled;
- If resource sharding is used, every etcd has independent backups, monitoring, and recovery ordering.
Scheduling, Network, and Validation
- Scheduling load tests include real resource fragmentation, topology, taints, volumes, and extension plugins;
- DNS, EndpointSlice, Service, NetworkPolicy, and route convergence have targets;
- Pod/Service CIDR, node networking, connection tracking, and cloud network quotas have headroom;
- Simulated-node conclusions have not replaced real kubelet, CNI, and CSI tests;
- Steady state, change, elasticity, failure, and recovery all have raw evidence and stop conditions.
12. What I Would Ultimately Choose
For a general enterprise platform, I would prefer to keep a single cluster within the range that upstream and our own continuous validation cover, use multiple clusters to reduce failure radius, and then solve fragmentation through unified scheduling and capacity views. For AI/HPC scenarios, if one node usually runs only one large Pod, scheduling constraints are relatively stable, and splitting clusters would significantly lose the available node set for large-scale jobs, only then would I seriously evaluate a single cluster above 5000 nodes.
Once on this path, optimization work is no longer "make API Server memory bigger." The platform must be able to explain every kind of control-plane traffic, control the rate at which nodes and objects enter, give etcd clear headroom on disk, network, and recovery, and put scheduling, DNS, CNI, CSI, and business recovery into the same set of scale gates. Reaching 10,000 nodes is only a stage result; being able to stop and recover during releases, scaling, and failures is the real evidence that the system is usable.
References
- Kubernetes: Considerations for large clusters
- Kubernetes SIG Scalability: Thresholds
- Kubernetes perf-tests: ClusterLoader2
- etcd v3.6: Tuning
- etcd v3.6: Maintenance
- etcd v3.6: Disaster recovery
- OpenAI: Scaling Kubernetes to 7,500 Nodes
- Uber: Migrating the Compute Platform to Kubernetes
- AWS: Amazon EKS Ultra-Scale Clusters
- Alibaba: Performance Optimization of the Kubernetes Control Plane at Ten-Thousand-Node Scale
- Ant Financial: Kubernetes Cluster Practice from Zero to Over Ten Thousand Nodes
- Alibaba ASI: Ultra-Large-Scale Kubernetes Fully Managed Operations and Maintenance System
- ByteDance: Performance Optimization Sharing for Kubernetes Clusters with Over 20,000 Nodes
- ByteDance: From Hybrid Deployment to Converged Scheduling
- KubeWharf: KubeGateway
- KubeWharf: KubeBrain
- KubeWharf: Gödel Scheduler