DeepSeek 1017: Production Observations on PRO 5000 and H20
After seeing DeepSeek-V4.1-Flash running on RTX PRO 5000, the immediate questions were whether it could replace the earlier H20 deployment and how latency and cost would change.
This analysis reads existing production monitoring and deployment configuration. It sent no inference requests, generated no benchmark traffic, and changed no services. The H20 group had lower first-token and request-level token latency; the PRO 5000 group experienced brief queues despite average GPU utilization of only 14.27%. Looking more closely reveals substantial workload and cache-path differences. Dividing their output throughput would produce a ratio with no hardware-comparison meaning.
The window is October 19, 2026, 17:40–18:40 Beijing time (UTC+08:00). Company, cluster, business-domain, node, and instance identities are redacted. Replicas are named PRO-01 and H20-01 through H20-04.
1. Establish Which Deployments Are Being Compared
The PRO group contains 1 replica and the H20 group 4 replicas, with 8 GPUs allocated to each replica. Monitoring reports the PRO model as NVIDIA RTX PRO 5000 72GB Blackwell, rather than the 48GB variant discussed in the earlier plan.
Both deployment configurations reference a DeepSeek-V4.1-Flash-1017 directory. This establishes what their configuration declares; production weight hashes were not rechecked, and running processes were not inspected to confirm parallelism. An eight-GPU allocation is therefore not presented as confirmed TP8. Matching model names also do not replace configuration checks.
| Item | PRO 5000 group | H20 group |
|---|---|---|
| Sample scope | 1 eight-GPU replica | 4 eight-GPU replicas |
| Model label | RTX PRO 5000 72GB Blackwell | H20-3e |
| DCGM Used + Free | 72,830 MiB per GPU, about 71.12 GiB | 143,155 MiB per GPU, about 139.80 GiB |
| Image-tag family | v0.31.0, built October 14 | v0.31.0, built October 19 |
| Engram CPU offload | Explicitly enabled | Explicitly enabled |
| KV Cache dtype | Explicit FP8, including explicit FP8 Indexer KV | Not explicit in the additional arguments; no effective default is assumed here |
| Block size | 128 | 64 |
| Maximum context / sequence count | 204,800 / 32 | 204,800 / 32 |
| DSpark draft tokens | 5 | 5 |
| Adaptive verification | Disabled | Enabled |
| External KV connector | MooncakeStoreConnector | Not configured in the additional arguments; external-cache query increase was 0 in the window |
| CPU request / limit | 120 / 240 cores | 80 / 160 cores per replica |
| Memory request / limit | 700 / 700 GiB | 1,920 / 1,920 GiB per replica |
DCGM means NVIDIA Data Center GPU Manager. The capacities above are sums of monitoring fields, not product-rated capacity or necessarily all physical memory. Image tags do not prove identical package versions or commits. This analysis did not enter production containers to inspect runtime packages, so implementation differences between builds remain possible.
1.1 Hardware Differences: 72GB GDDR7 Versus 141GB HBM3e
Both groups allocate eight GPUs, but their hardware differs. PRO 5000 is a Blackwell professional workstation GPU; H20-3e belongs to the Hopper data-center family. A newer architecture does not make every large-model service faster.
| Hardware dimension | RTX PRO 5000 72GB Blackwell | H20-3e 141GB |
|---|---|---|
| Architecture and form factor | Blackwell, professional PCIe card | Hopper, SXM5 / HGX server platform |
| Rated memory per GPU | 72 GB GDDR7 with ECC error correction | 141 GB HBM3e |
| Sum of eight rated capacities | 576 GB | 1,128 GB, about 1.96 times the former |
| Rated memory bandwidth | 1,344 GB/s, or 1.344 TB/s | The cited official material does not specify bandwidth for this 141GB SKU; no estimated value is substituted |
| Host attachment and multi-GPU communication | PCIe 5.0 ×16; actual inter-GPU paths on these hosts were not collected | SXM5; an earlier same-model H20 validation recorded NV18 between GPU pairs, but this production topology was not rechecked |
| Kernel compatibility | Fifth-generation Tensor Cores with FP4 support; CUDA compute capability 12.0 | Hopper execution paths; the runtime still selects specific quantization and attention kernels |
| Board power and cooling | Official total board power of 300 W, active cooling | Power limits on these boards were not verified; observed operating power appears below |
PRO memory, bandwidth, interface, power, and Tensor Core specifications come from the NVIDIA product page and official datasheet. The NVIDIA vGPU documentation places H20 under Hopper and identifies SXM5. The NVIDIA R595 release notes list H20 141GB HBM3e, H20A 96GB HBM3, and H200 separately. Specifications for 96GB H20 or H200 therefore cannot simply be assigned to this H20-3e.
Summing eight GPUs is only a starting point for capacity planning, not a freely allocatable unified memory pool. Weight shards, per-GPU KV Cache, workspaces, and communication buffers must each fit. Product-rated GB also cannot replace the DCGM MiB / GiB values above.
1.2 What These Differences Mean for DeepSeek Inference
Memory capacity affects deployment headroom. With eight GPUs each, H20 has almost twice PRO's rated capacity. Matching weight partitioning and cache precision would generally leave more space for KV Cache and workspaces. PRO explicitly uses FP8 KV here, and its allocated memory approaches the monitored capacity. However, KV usage was not full, so capacity alone cannot explain the queues.
Local memory bandwidth and PCIe bandwidth are different resources. Reading weights and KV Cache on a GPU uses GDDR7 or HBM. Transfers from CPU memory involve host memory and PCIe. Prefill processes input and typically makes better use of matrix compute; small-batch decode generates tokens incrementally and is more susceptible to weight and KV read bandwidth. Batch size, context, and cache hits change the bottleneck. See NVIDIA's inference optimization explanation. PCIe 5.0 support therefore does not replace an assessment of local memory bandwidth; neither GPU's effective memory bandwidth was measured in this window.
Interconnects affect the cost of cooperation on every step. Tensor parallelism exchanges intermediate results, while expert parallelism can distribute tokens across GPUs. The historical H20 NV18 topology denotes an aggregated NVLink path; see the earlier H20 test. PRO's PCIe multi-GPU paths require checking switches, CPU sockets, and Peer-to-Peer (P2P) support. They cannot be assumed equivalent to HGX, nor does PCIe imply that every transfer must stage through CPU memory. Historical topology does not establish this production host's topology.
Low-precision capabilities require suitable kernels. NVIDIA lists PRO 5000 at compute capability 12.0 and B200 at 10.0: both are Blackwell, but they are different compilation targets. See the CUDA GPU compute-capability table. PRO's FP4 support does not establish that this FP8 model used FP4 kernels. Sparse FP4 AI TOPS also cannot be compared directly with another GPU's dense FP8 / BF16 peak.
CPU offload and the rest of the server matter. Both groups enable Engram CPU offload, making host memory bandwidth, NUMA (Non-Uniform Memory Access) placement, and CPU–GPU transfers relevant alongside the GPU. PRO's external KV cache adds another data path. These are directions for correlated investigation; the queue curves do not yet identify a bottleneck among them.
Power must use matching definitions, too. PRO's 300 W is an official board specification; the roughly 95 W below is a board mean under this traffic. H20's roughly 317–327 W is also an operating observation. These do not constitute an efficiency test under matching load and exclude CPU, memory, and networking. Enterprise selection should compare whole-system throughput and total cost at matching latency requirements, rather than architecture generation or the price of eight cards alone.
2. Collection and Statistical Definitions
Application metrics come from the existing vLLM collection; GPU metrics come from existing DCGM collection. Each of the five instances has 60 application samples in the window, and each GPU has 60 utilization samples. No generation-token counter resets were observed during the window.
The calculations use these definitions:
- Token and completed-request increases use one-hour
increase. Boundary extrapolation produces estimates and can legitimately yield fractional values; these are not audited integer request counts. - Wall-clock output rate is generated-token increase divided by 3,600 seconds. H20 totals are additionally divided by 4 for a per-replica mean; this is not saturated capacity.
- Request means divide the increase of histogram
_sumby the increase of_count. H20 P95 merges all four replicas' buckets before estimating the quantile; it does not average four P95 values. - Average GPU utilization is weighted by valid GPU samples. The H20 resource curve below averages its four eight-GPU replicas; individual-replica ranges are listed separately.
The name request_success_total can mislead. Here, its stop, length, abort, error, and other finish-reason counters are observed without validating client stream completeness, final answers, or business correctness. They do not establish a 100% request success rate.
3. Examine Request Shapes Before Throughput
| Metric over the one-hour window | PRO 5000 | H20 |
|---|---|---|
| Estimated completed-count increase / replica | 2,142.7 | 2,867.5 |
| Completion rate / replica | 0.595 requests/s | 0.797 requests/s |
| Mean input per request | 20,206.8 tokens | 68,868.6 tokens |
| Mean output per request | 14.03 tokens | 544.03 tokens |
| Mean requested output limit | 14.03 tokens | About 23,260–24,304 tokens across replicas |
| Wall-clock output rate / eight-GPU replica | 8.35 tok/s | 433.59 tok/s |
H20 completion counts and output rates are normalized across four replicas; request lengths are weighted by completed requests. PRO generated-token increase is about 30.1 thousand, while the four H20 replicas total about 6.2437 million. These are outputs actually produced by this traffic, not measurements under matching loads.
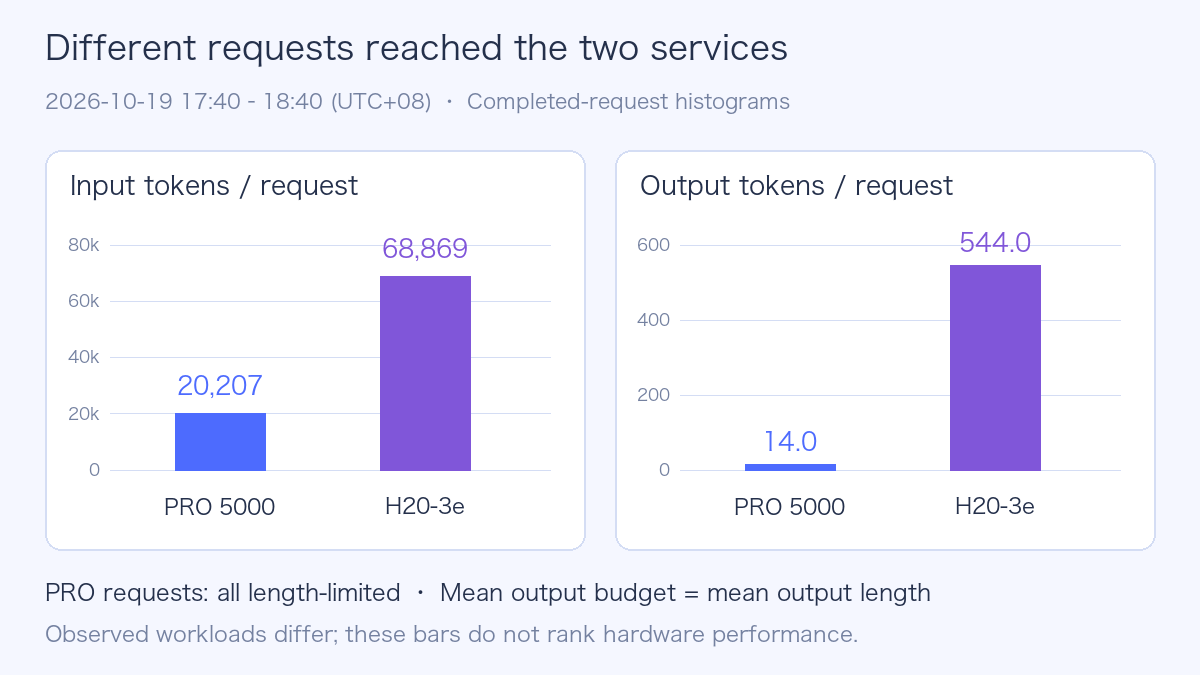
All completed PRO requests ended with length, and their mean requested output limit matches their mean actual output length. Approximately 82.15% had an output limit of no more than 20 tokens, and 95.82% no more than 50. This is predominantly short-output traffic. Existing histograms do not identify its business purpose or establish answer quality.
H20 completions were predominantly stop; length accounted for about 2.11%. In both groups, the selected counters show zero increase for abort, error, and repetition. Failures before engine admission, client stream interruptions, and unexposed errors fall outside that observation.
Thus, 8.35 and 433.59 tok/s describe online output, but do not establish that H20 is dozens of times faster. Output budgets, traffic duration, and configuration all differ.
4. Current Latency: H20 Is Lower, but Where Does the Difference Arise?
TTFT means Time to First Token as recorded by the server. TPOT means Time per Output Token averaged within each completed request. E2E means End-to-End server request latency. These are existing engine metrics, not newly measured client-side final-answer latency.
| Request-level metric | PRO mean | H20 mean | PRO P95 | H20 P95 |
|---|---|---|---|---|
| TTFT | 2.333 s | 1.050 s | 16.663 s | 5.000 s |
| TPOT | 64.17 ms | 6.01 ms | 373.71 ms | 17.11 ms |
| E2E | 3.009 s | 4.319 s | 20.458 s | 17.718 s |
| Queue time | 1.704 s | 0.245 s | 13.514 s | 0.299 s |
The H20 group had lower TTFT and TPOT in this window. PRO appears to have a shorter mean E2E, but generates only 14 tokens on average, versus 544 for H20. The fact that 3.009 seconds is below 4.319 seconds does not mean PRO completes the same task faster.
PRO mean queue time is about 73.0% of mean TTFT. This is a ratio of means, not attribution by subtracting or dividing two P95 values. Queuing clearly contributes to waiting, but the evidence does not identify CPU offload, scheduling budgets, external KV transfers, or another stage as the cause.
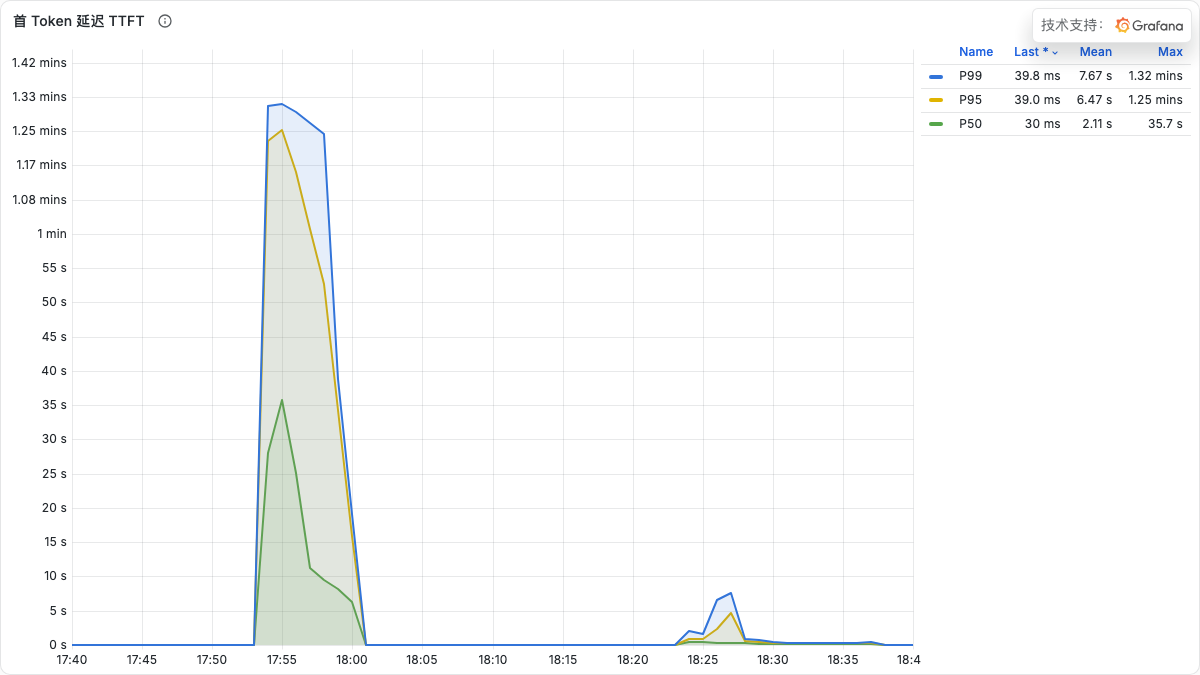
Real native PRO panel with unrelated promotional overlays hidden. Curves are five-minute rolling P50/P95/P99; rolling P95 briefly reached about 75 seconds, which is not the whole-hour P95.
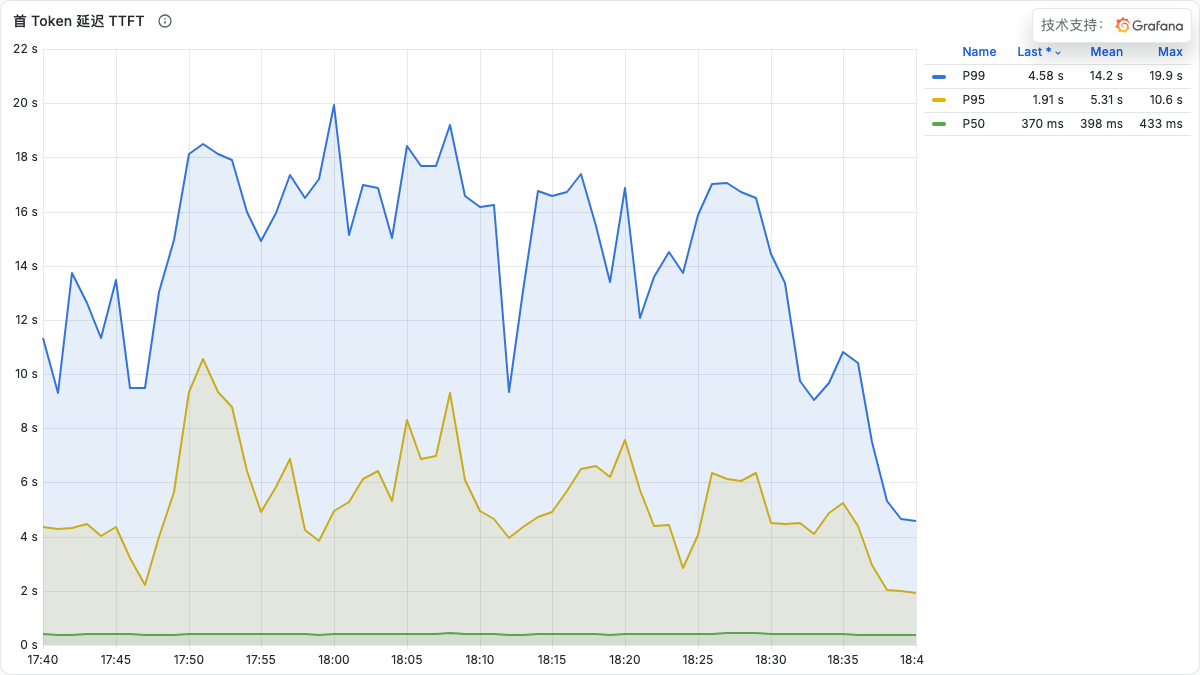
The H20 panel uses the same time window. Native vertical axes autoscale differently, so compare their tick values rather than curve heights. Legend Mean averages plotted samples, not the request-weighted means in the table.
Another distinction matters: inter_token_latency_seconds records gaps between output events; speculative decoding may bundle several tokens in an event. This article uses request_time_per_output_token_seconds. The versioned documentation states that server TPOT histograms record zero for requests generating at most one token, while the benchmark client excludes them. Online and earlier benchmark TPOT statistics therefore cannot simply be pooled. vLLM metrics design
5. Why Queues Can Coexist with Low GPU Utilization
| Resource observation | PRO-01 | H20 individual-replica range |
|---|---|---|
| Mean GPU utilization | 14.27% | 91.93%–95.48% |
| Mean memory used per GPU | 68.82 GiB | 127.06–127.57 GiB |
| Maximum sampled memory used per GPU | 69.44 GiB | 127.06–127.57 GiB |
| Mean GPU board power per GPU | 95.02 W | 317.30–327.39 W |
| Sampled mean Running requests | 0.53 | 2.65–3.30 |
| Sampled mean Waiting requests | 0.97 | 0.18–0.55 |
| Sampled maximum Waiting requests | 21 | 4–8 |
| Sampled maximum KV usage | 17.57% | 1.77%–2.71% |
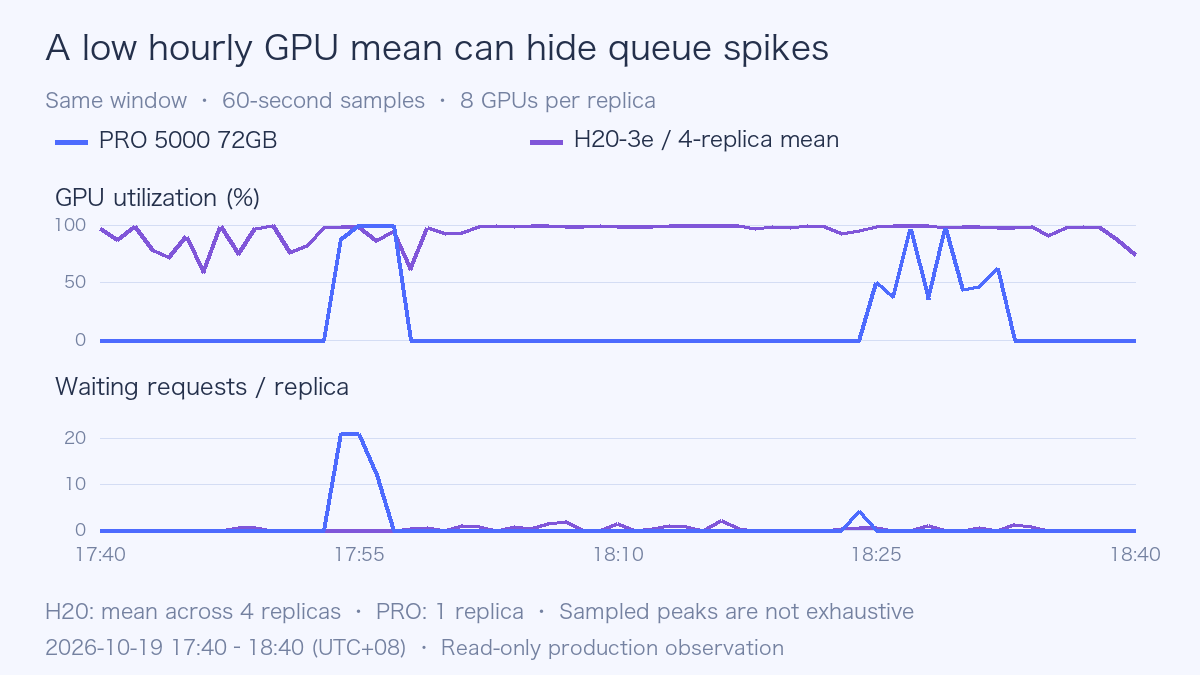
PRO activity is concentrated in a few minutes. At the 17:54, 17:55, and 17:56 samples, queue counts were 21, 21, and 12; running counts were 3, 4, and 8; and eight-GPU mean utilization was 88.5%, 100%, and 100%. Low hourly utilization and substantial queues in those minutes are compatible observations.
Another sample at 18:24 warrants follow-up: Running was 11 and Waiting 4, while sampled GPU utilization was 0. Application state and GPU activity measure different things, and independent scrapes may not align precisely. This suggests examining execution and transfer paths in the same interval, not diagnosing a NIC, CPU, or GPU fault from one point.
For waiting-reason metrics, PRO sampled maxima were 21 for capacity and 4 for deferred. These scheduler classifications should not be translated directly into “GPU memory exhausted” or “Mooncake failure.” Preemption counters show zero increase in the window. Xid and container working-set queries returned no series; absence of data is not evidence of absence of problems.
Memory usage near reported device capacity also does not mean requests have filled the KV Cache. The engine may reserve cache space, while weights and workspaces also consume memory. kv_cache_usage_perc reports the fraction of logical cache blocks in use, with 1 representing 100%. Metric definitions for the corresponding version
6. Caching and DSpark Change the Computation Path
Both groups reuse substantial input. H20's mean input near 69 thousand tokens does not mean recomputing that entire input for every request.
| Cache and speculative-decoding metric over one hour | PRO 5000 | H20 |
|---|---|---|
| Local prefix-cache token hit rate | 92.53% | 96.36% |
| External KV query token hit rate | 33.40% | Zero query increase; no ratio calculated |
| Locally computed input tokens / replica, approximately | 2.1531 million | 7.1631 million |
| Draft-token acceptance rate | 47.06% | 50.58% |
| Mean tokens per verification step, including the bonus token | 3.35 | 3.53 |
Prefix hit rate counts queried tokens, not the fraction of requests that hit completely. The 33.40% external KV hit rate has its own external-query denominator and cannot be added directly to 92.53%. PRO's external-transfer input-source counter increased, confirming a different cache path that can save computation while adding lookup and transfer work.
PRO's Mooncake counters show actual reads and writes, with zero increase in failed-key counters. Mean load_get operation latency is about 101.8 ms. This is an operation mean, not additional mean waiting per request, and does not explain queue P95 of 13.5 seconds. Without request-level correlation, the tail cannot be attributed to Mooncake.
DSpark is a speculative-decoding path. Draft acceptance divides accepted tokens by drafted tokens; mean acceptance length uses 1 + accepted / drafts. These describe progress per verification step, not overall service speedups of 3.35× or 3.53×. Adaptive verification also differs between the groups. Acceptance-metric definitions
7. Relating This to the Earlier H20 Day0 Results
The earlier 1017 H20 Day0 experiment fixed input/output lengths, concurrency limits, and three repeated rounds. This production observation has none of those workload controls.
| Condition | Earlier H20 experiment | Current production observation |
|---|---|---|
| Workload | Fixed-length synthetic requests; defined C1/C8/C32 | Existing request histograms; no prompts collected |
| Engram | Kept on GPU | CPU offload configured in both groups |
| Prefix caching / DSpark | Both disabled | Cache hits observed; DSpark uses 5 draft tokens |
| Service context | 32,768 for the base matrix; separate 1M configuration | 204,800 configured in both groups |
| Engine identifier | Measured vLLM 0.32.0rc1.dev329+g39983a5e7 | v0.31.0 image-tag family, with different builds |
| Latency calculation | Per-round P95 of successful requests, then median across complete rounds | P95 estimated after merging one-hour histogram buckets |
The four earlier C8 workloads remain useful fixed-load references:
| Historical input → output / C8 | Output throughput | P95 TTFT | P95 TPOT |
|---|---|---|---|
| 1,024 → 128 | 569.2 tok/s | 568.5 ms | 12.68 ms |
| 8,192 → 128 | 223.6 tok/s | 3,208.9 ms | 30.96 ms |
| 1,024 → 512 | 727.0 tok/s | 566.8 ms | 10.67 ms |
| 24,576 → 128 | 90.9 tok/s | 9,568.1 ms | 74.01 ms |
Those values answer how that H20 configuration performed at specified lengths and concurrency. Online observation answers how current traffic and configuration behave. The records complement each other, but no reliable conversion turns online 14-token responses into historical 512-token benchmark results.
8. What This Observation Contributes to Selection and Diagnosis
There is operational evidence of deployment feasibility. Monitoring shows an eight-GPU PRO 5000 72GB service generating tokens, configured with CPU Engram offload, FP8 KV, and an external cache. This supports that combination working; it does not establish single-GPU deployment or equivalent feasibility on the 48GB variant.
PRO's queue tail deserves attention first. Correlate existing scheduler, cache, CPU, and network metrics around concrete intervals such as 17:54–17:56. Existing request traces, if available, can further locate waiting stages. This analysis did not alter collection, enable tracing, or tune production parameters.
H20 delivered lower TTFT and TPOT in this window. That is an observation about these deployments and this traffic. Different output budgets, caches, builds, CPU allocations, and DSpark options prevent attributing the entire difference to GPUs.
Cost can only be decomposed for now. PRO has lower mean GPU board power alongside different activity duration and output volume. Board power omits CPU, memory, networking, storage, and whole-machine idle power; both configurations also depend on CPU offload. Without comparable service targets, useful completed work, and machine cost, this does not establish a lower cost per million tokens.
Read-only production monitoring already reveals mismatched configuration, different workloads, and brief queues. That is a more useful outcome from these data than a hardware ranking.
9. Rechecking the Calculations and Public Data
These selectors are sanitized examples. Replace them with actual Pod selectors before reuse; no such labels or rules were added to production.
# Whole-window request-level P95; merge buckets before estimating.
histogram_quantile(0.95,
  sum by (le) (
    increase(vllm:time_to_first_token_seconds_bucket{
      pod_name=~"pro-model-.*"
    }[1h])
  )
)
# Request-weighted mean output length.
sum(increase(vllm:request_generation_tokens_sum{pod_name=~"pro-model-.*"}[1h]))
/
sum(increase(vllm:request_generation_tokens_count{pod_name=~"pro-model-.*"}[1h]))
# GPU-sample-weighted utilization, including allocated GPUs at zero utilization.
sum(sum_over_time(DCGM_FI_DEV_GPU_UTIL{pod_name=~"pro-model-.*"}[1h]))
/
sum(count_over_time(DCGM_FI_DEV_GPU_UTIL{pod_name=~"pro-model-.*"}[1h]))
The public observation dataset contains sanitized aggregates, five-replica time series, and methodology notes. The figure generator reads only that public dataset. Native screenshots retain the original plots and values, with unrelated promotional overlays hidden and no internal identifiers retained.
References: vLLM production metrics, DeepSeek 1017 model card, earlier original V4.1-Flash H20 experiment.