Firecracker Experiment Results and Operations Manual
The designated experiment subset, namely experiments 1, 2, 3, 5, and 7, was executed on dedicated Workers. Unless explicitly stated as repeated measurements, the results below are smoke tests and compatibility observations.
Executed Experiments
| No. | Experiment | Result | Evidence |
|---|---|---|---|
| 1 | Native snapshot and restore | Passed | Full snapshot recoverable by a new process; Guest networking and TCP/22 recovered |
| 2 | Kata concurrency | Passed | Three tiers of 1, 5, 10 Pods; failed Pods, VMM leaks, and snapshot leaks all 0 |
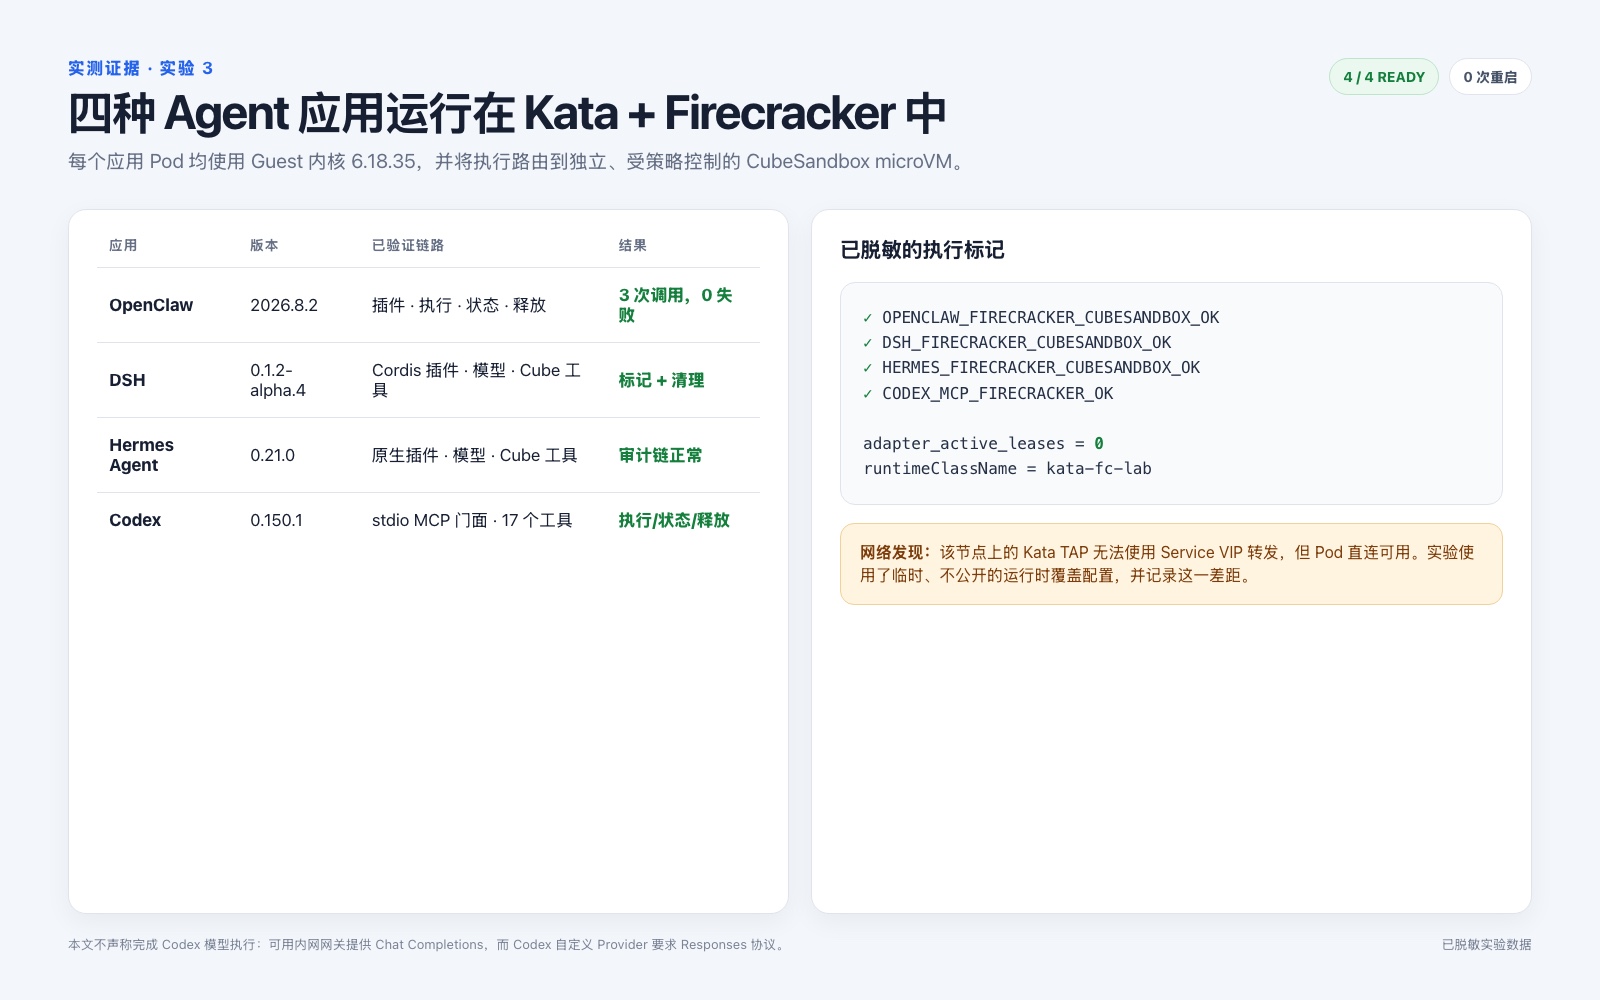
| 3 | Agent applications | Passed, but Codex model limited by protocol | OpenClaw, DSH, Hermes model/tool runs passed; Codex Adapter and MCP chain passed |
| 5 | Observability | Passed | Payload, VMM, host, devmapper, and Adapter signals collected |
| 7 | Jailer/security baseline | Passed | chroot, namespaces, cgroup, Capabilities, NoNewPrivs, and seccomp checked |
1. Native Snapshot and Restore
After pausing the Guest, a full snapshot was created via the Firecracker API. The VM state, memory, metrics, and the accompanying root filesystem were preserved as a single experiment package.
| Measurement | Observed Value |
|---|---|
| Snapshot creation | 188.82 ms |
| Snapshot memory file | 256 MiB |
| VM state file | 23 KiB |
| Restore API | 16.86 ms |
| Guest ping Ready after restore | 26.15 ms |
| Guest cold-boot ping baseline | 1.280 s |
| Observed Ready time ratio | Restore approximately 49x faster than single cold-boot baseline |
| Services restored | ICMP and TCP/22 passed; VM state is Running |
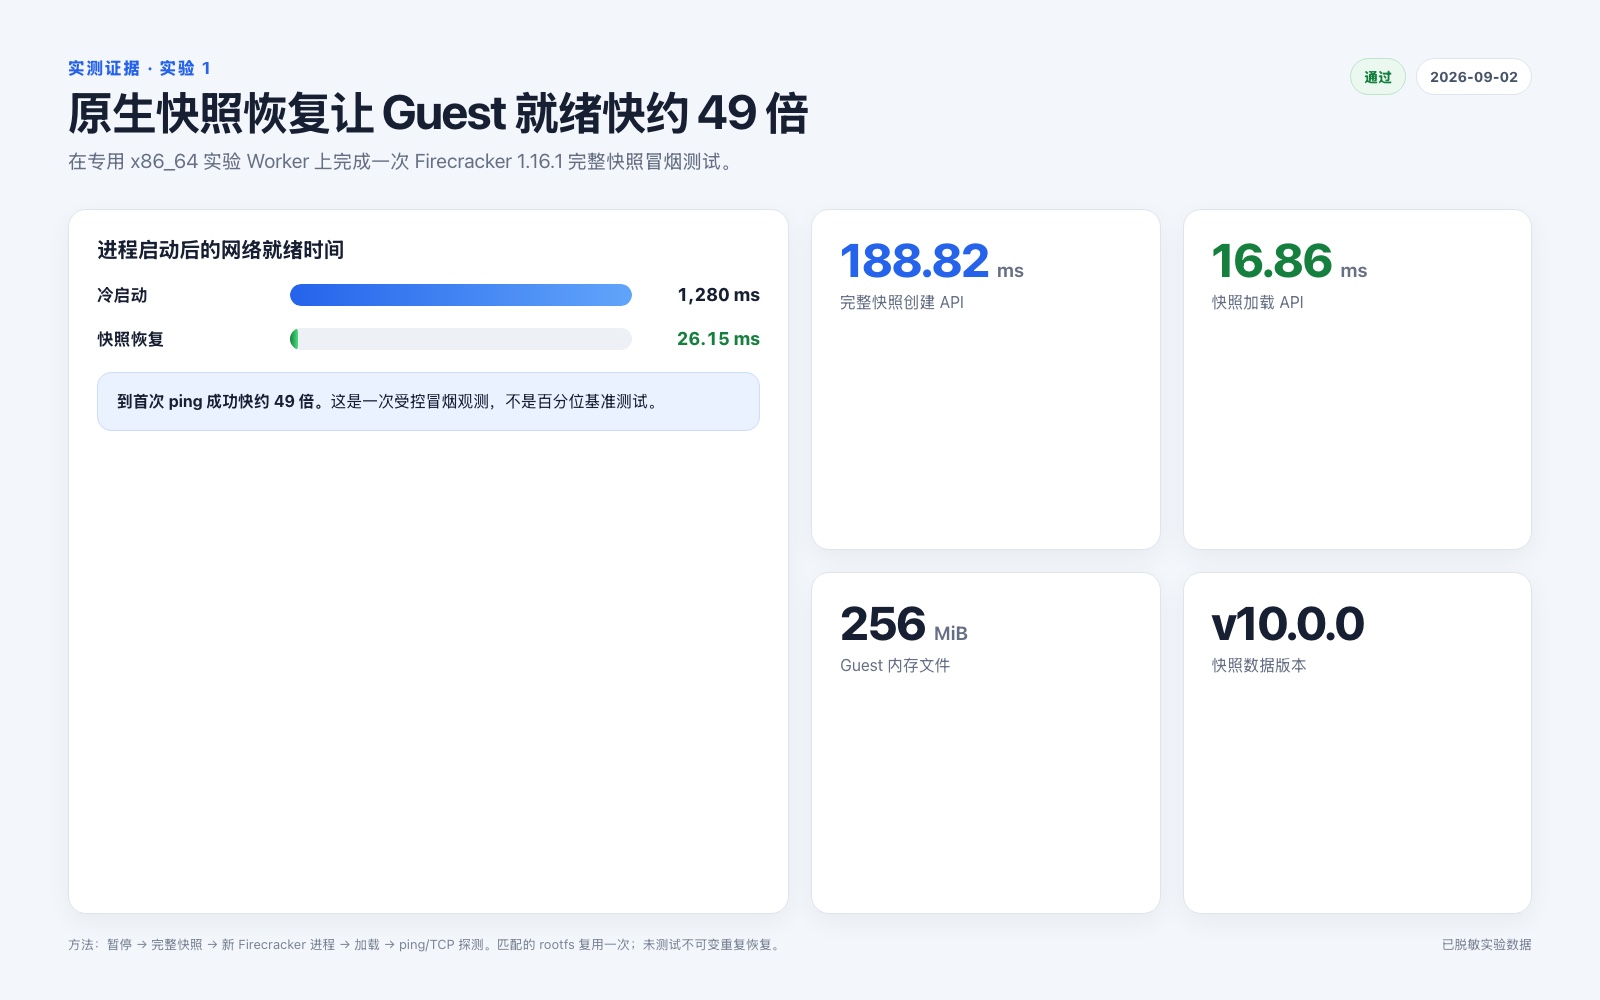
This is not yet a repeatable snapshot benchmark. Only one restore instance was used in this round, and the root filesystem was not cloned as an immutable image for repeated restores. Firecracker snapshots do not include backend disks, so production tooling must version and integrity-check the VM state, memory, and all disks together.
2. Kata Concurrency
manifests/kata-fc-concurrency.yaml
Test batches with explicit size caps were created via kata-fc-lab.
| Batch | Observed Ready times | Summary |
|---|---|---|
| 1 Pod | 4 s | 1/1 passed |
| 5 Pods | 4, 5, 6, 7, 8 s | P50 6 s, max 8 s, 5/5 passed |
| 10 Pods | 4, 5, 5, 6, 6, 6, 7, 8, 8, 8 s | P50 6 s, P95 8 s, max 8 s, 10/10 passed |
Peak host state was 11 Firecracker processes, including the reserved Workbench, with aggregate VMM RSS of approximately 1.45 GiB. After deleting each batch, only the reserved Workbench VMM and its expected active devmapper snapshot remained.
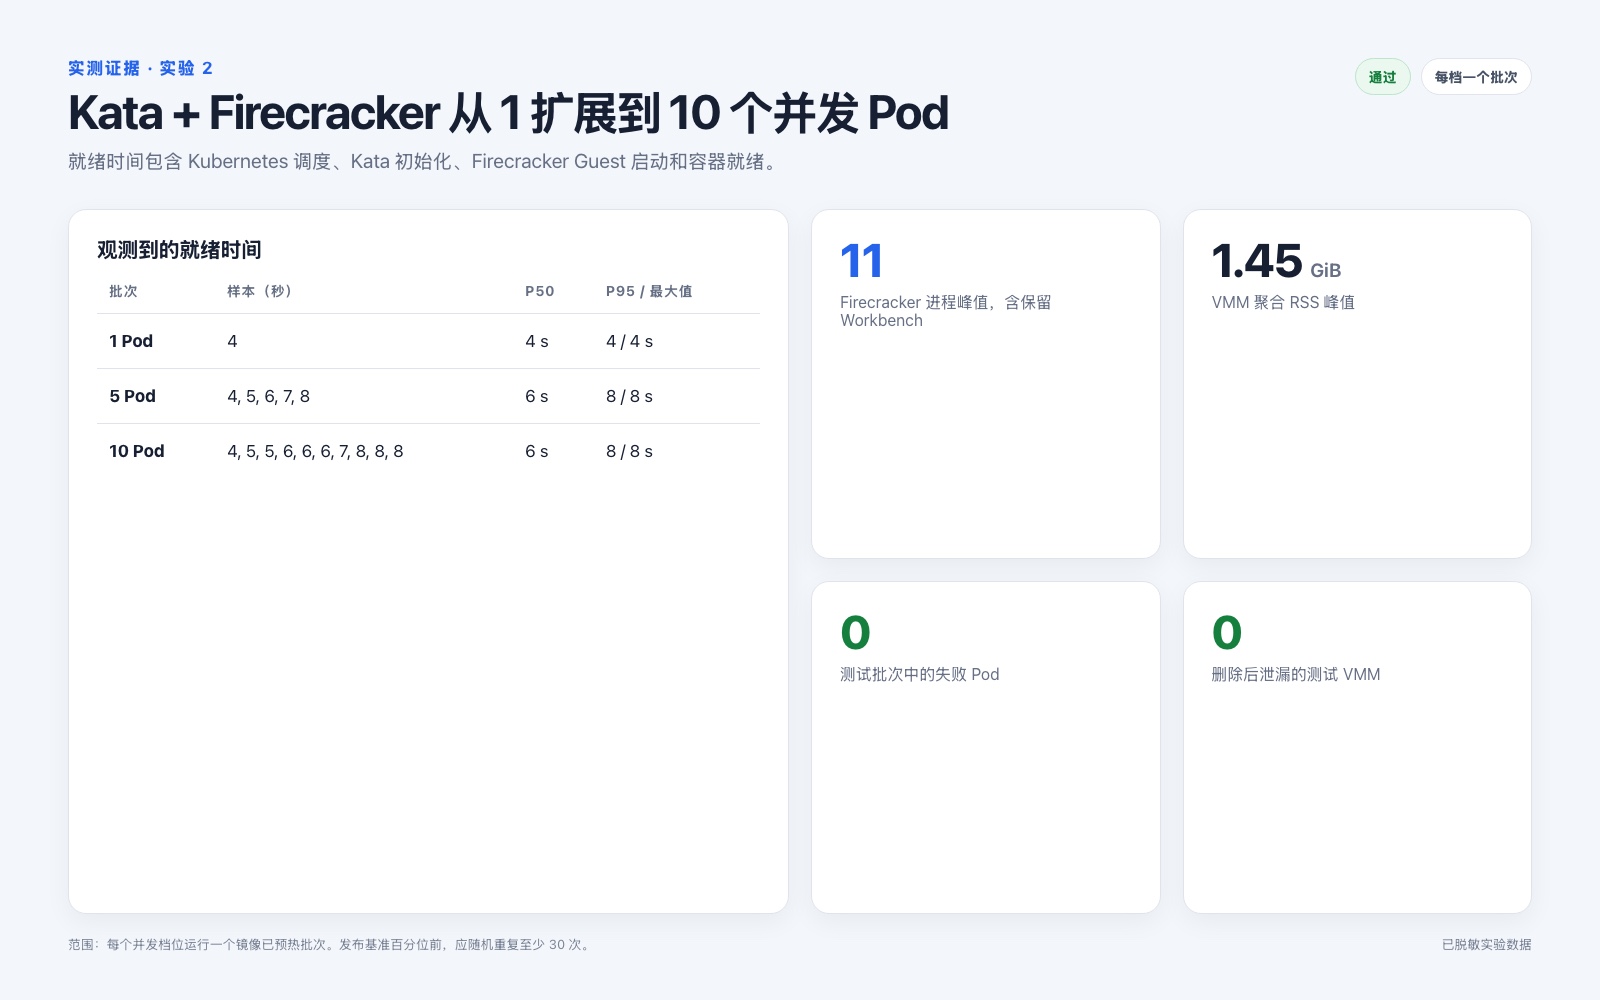
This is a bounded smoke test, not a saturation benchmark. Production research should repeat at least 30 randomized runs and cover 50/100 Pods, P99, API rate limiting, CPU contention, and deletion latency.
3. Agent Applications
OpenClaw, DSH, Hermes, and Codex were all deployed as Kata/Firecracker Pods and tested through the CubeSandbox Adapter. Versions, credential policies, product screenshots, network discovery, and Codex protocol limitations are documented in the full Agent guide.
5. Observability
Measurements deliberately separated Payload memory from host-side VMM RSS. At the sampling moment, the four Agent Payloads totaled approximately 1.07 GiB; the five Firecracker processes, including the reserved Workbench, totaled approximately 2.68 GiB RSS. After the tasks completed, the Adapter reported 0 active leases.
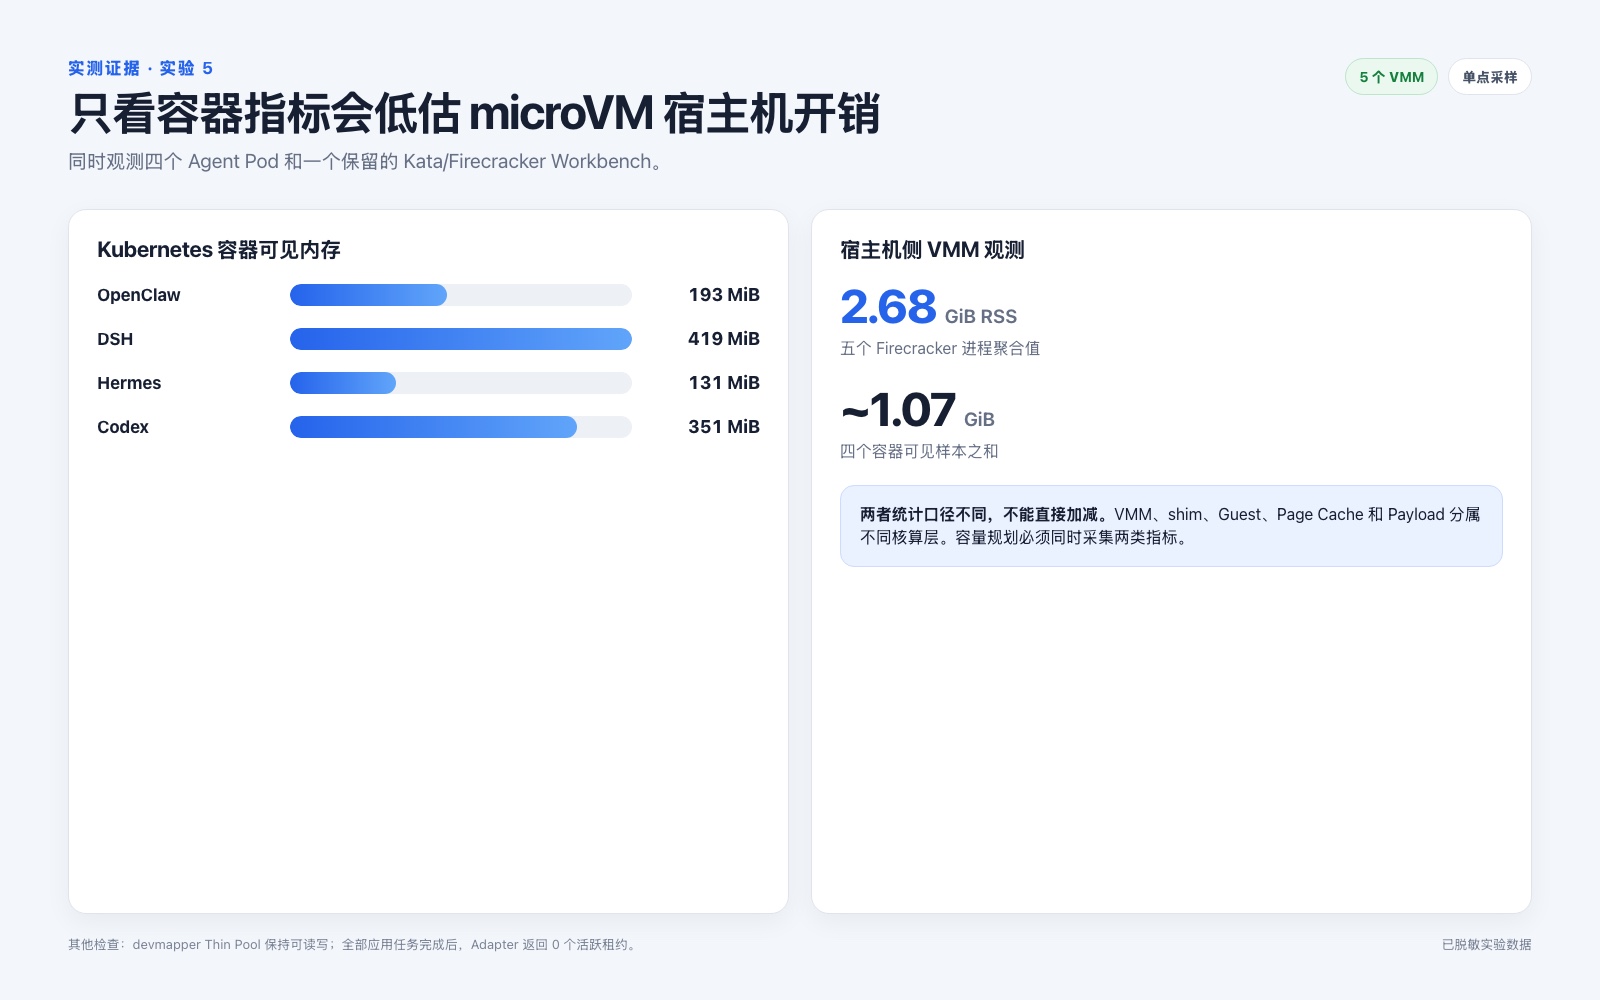
Collection and interpretation details are in Observability and Resource Accounting.
7. Jailer and Security Baseline
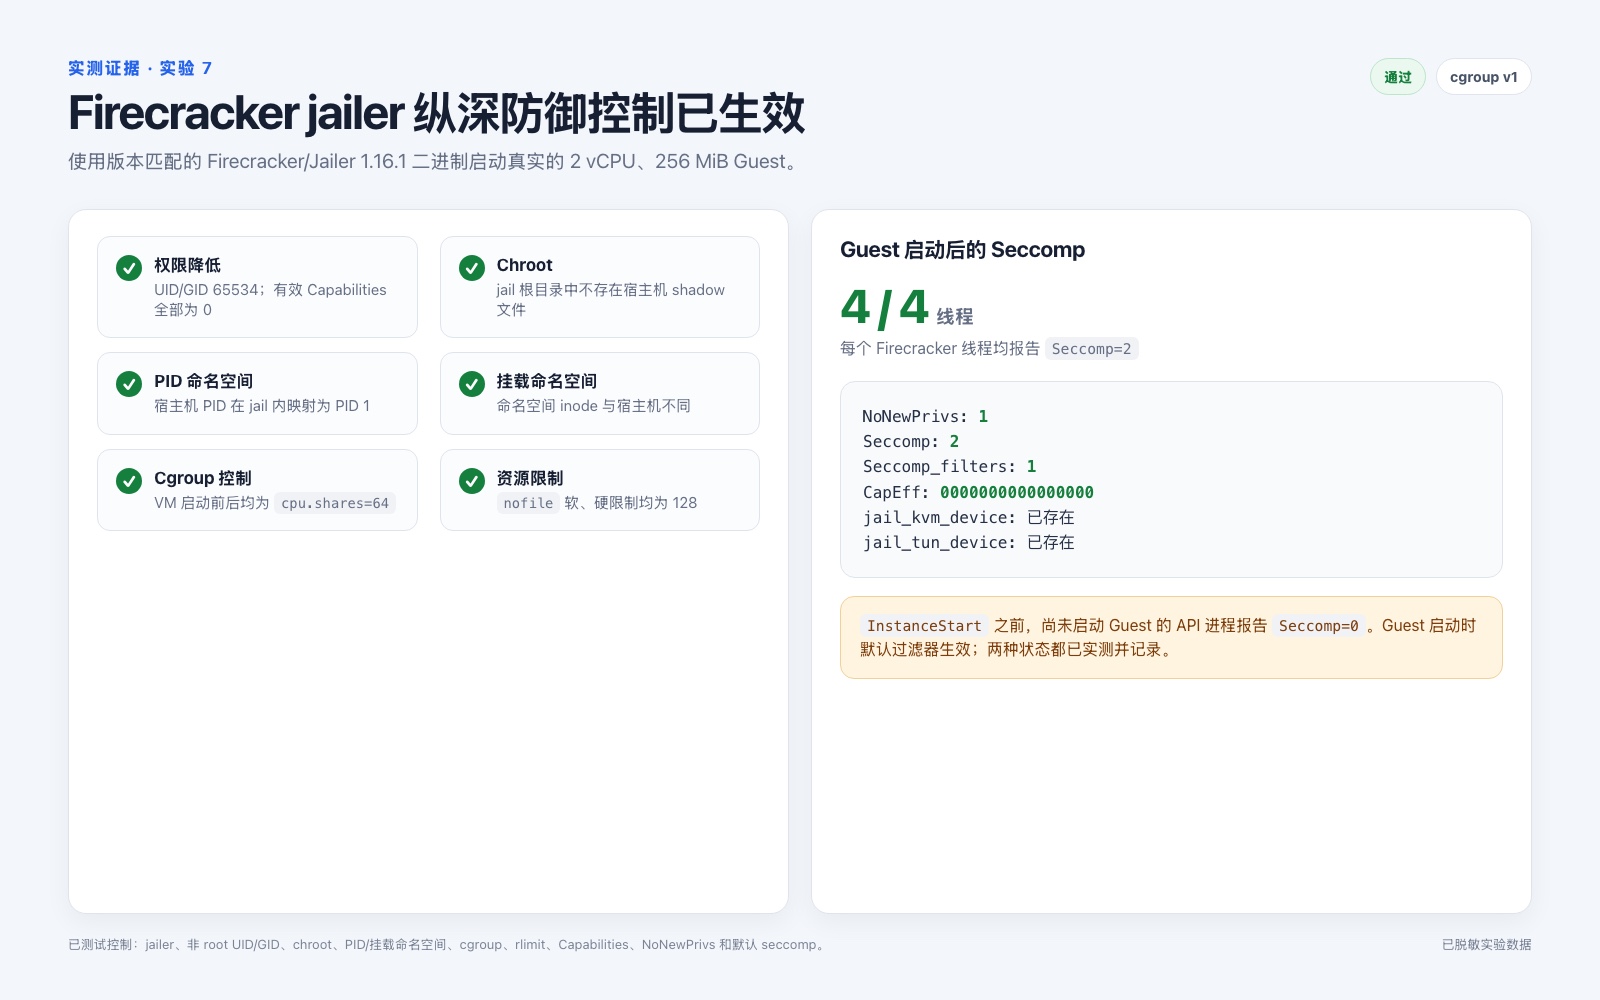
Using an unprivileged identity, a native 2 vCPU, 256 MiB Guest was started by jailer 1.16.1. After startup, the VMM's effective Capabilities were 0, NoNewPrivs=1, and all four observed threads were in seccomp filter mode 2. chroot, PID/mount namespaces, cgroup shares, rlimits, and explicitly created device nodes were also checked.
Constraints and production requirements are in Jailer and Security Baseline.
Deferred Experiments
The following items were intentionally not executed in this round:
- MMDS and vsock control channels;
- Network and block device rate limiting, memory balloon, and resource pressure/OOM behavior;
- PVC and NetworkPolicy combination matrix;
- Injected shim/VMM kills, CNI interruptions, Thin Pool exhaustion, and node restart failures;
- Sustained 50/100 Pod concurrency, and statistically controlled comparison with CubeSandbox.