From Half an Hour to Five Minutes: Full-Pipeline Cold Start Optimization for Large Models
When we deployed DeepSeek-V4-Pro in the first half of this year, we ran into a problem we could not avoid: a single model rolling restart took nearly half an hour.
During a normal release, the old replicas could still carry traffic; if the service was already entirely unavailable, that half hour was the failure recovery time. For an inference service already serving real business traffic, this was almost unacceptable.
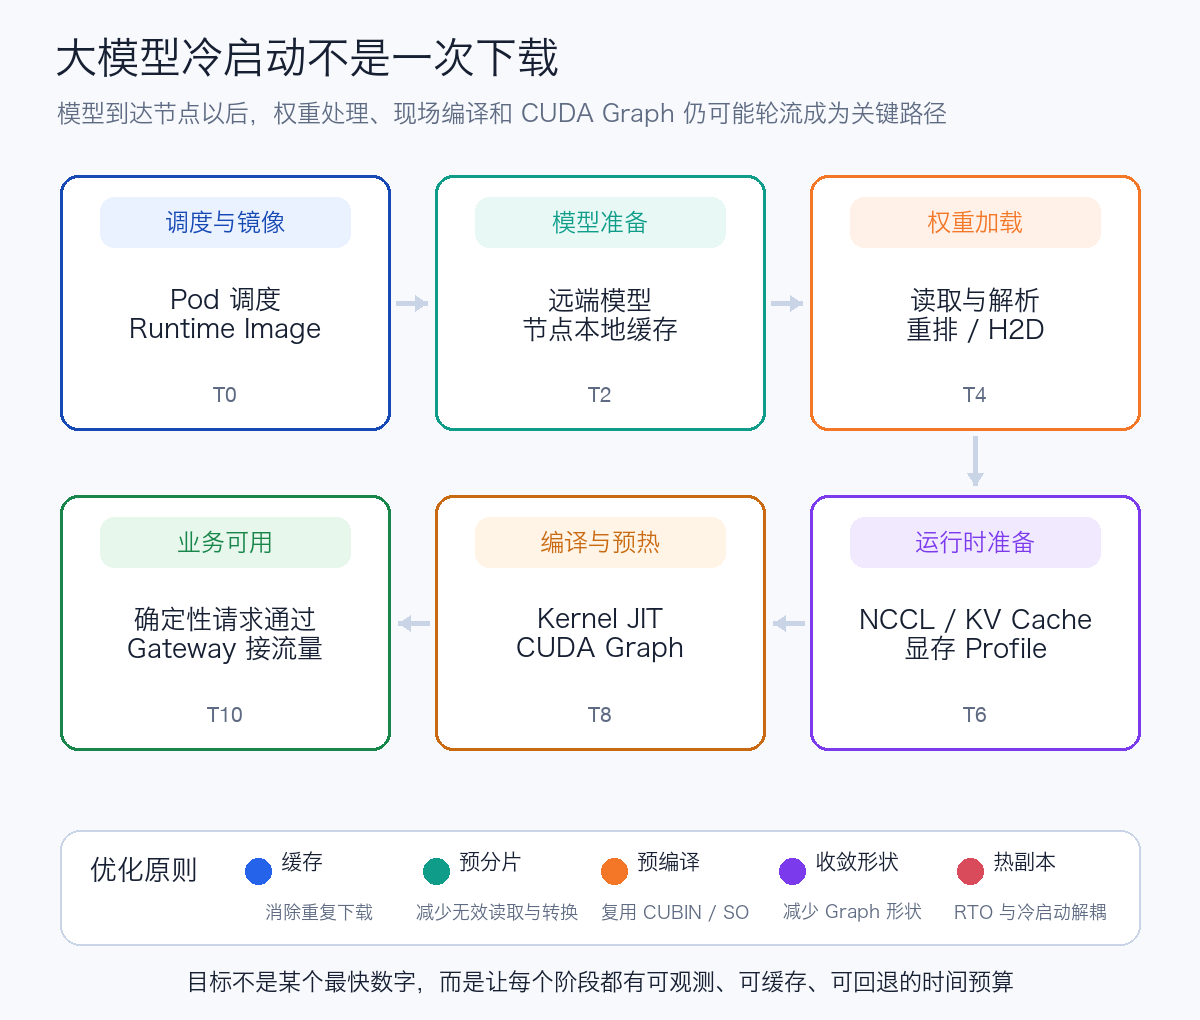
Initially we attributed the problem to model download. After the model was downloaded to the GPU nodes in advance, the download time did disappear, but the Engine still had to wait several minutes before serving. Later, by instrumenting each segment on the roughly 156 GiB DeepSeek V4 Flash, we confirmed that cold start is one continuous critical path:
English rendering — the original text is retained below.
This article answers three questions along that path: where the half hour goes, how each stage can be optimized, and what realistic targets can be set for a model in the 150 GiB class.
Cluster names, addresses, image registries, object storage, model paths, and credentials in this article have been removed or replaced. Timings come from a specific software/hardware combination and are only meant to illustrate magnitude and methodology, not as production capacity commitments.
1. Aligning on Definitions First: What Exactly Are We Measuring
"Startup only took 10 seconds" can refer to completely different things. Before discussing optimization, at least four states must be distinguished:
| Definition | Image | Node model | Compilation cache | Process and GPU state | Typical scenario |
|---|---|---|---|---|---|
| Full cold start | Miss | Miss | Miss | Does not exist | New node scale-out, disaster recovery |
| Node cache restart | Hit | Hit | May hit | Does not exist | Pod recreation, rolling release |
| Warm replica switchover | Hit | Hit | Hit | Ready | Release traffic shift, capacity insurance |
| Hibernation or snapshot recovery | Hit or restored with snapshot | Loaded or saved | Compiled | Saved or still retained | Second-level recovery experiments |
The V4-Pro experience of nearly half an hour was close to a full cold start. In production, the first priority is to compress "node cache restart" to the minute scale, then use warm replicas to guarantee failover; the second-level numbers from snapshot recovery must not be used to represent full cold start.
1.1 Unified T0–T9 Timing Boundaries
We use the following stage definitions:
English rendering — the original text is retained below.
T0  Deployment or Role revision created
T1  Pod scheduling completed, start preparing Runtime Image
T2  Init Container starts preparing model
T3  Model integrity check passed
T4  Inference process started
T5  Weight loading, conversion, and H2D completed
T6  JIT and Autotune completed
T7  CUDA Graph and built-in Warm-up completed
T8  /health, /v1/models, and deterministic generation requests passed
T9  Gateway adds replica to servable set
Port listening, Kubernetes Ready, first successful request, and Gateway starting to route traffic must all be recorded separately.
2. Baseline: Where the 23 Minutes Actually Went
A full cold start of DeepSeek V4 Flash provided fairly complete evidence: roughly 156 GiB model, 48 Safetensors shards, single node with 8×H20.
| Stage | Observed time | Conclusion |
|---|---|---|
| Model preparation | ~6 minutes | Effective throughput ~0.43 GiB/s |
| First pull of ~14.29 GB Runtime Image | ~127 seconds | Node image miss |
| NCCL initialization | ~19 seconds | Single node TP=8 |
| Reading 48 Target weight shards | ~25 seconds | Only the file-read portion visible in logs |
| Target CUDA Graph, 51 Batch Shapes | ~394 seconds | One of the largest single items in this round |
| DSpark Draft CUDA Graph | ~123 seconds | Additional cost of speculative decoding |
| Engine internal startup | ~854 seconds | Includes weight processing, JIT, Graph, and Warm-up |
| Pod creation to business Ready | ~23 minutes | Again approaching the half-hour window |
Even with the model already hitting the node cache, the problem is not solved:
- SGLang Combined first startup still took ~11 minutes, of which weight loading, conversion, and warm-up took ~278 seconds, and Decode CUDA Graph ~356 seconds;
- vLLM rebuild after node cache hit still took ~7 minutes 40 seconds, with the main time shifting to TileLang, DeepGEMM compilation, and CUDA Graph.
This yields the most important judgment of this article: optimization constantly shifts the critical path. After download disappears, Checkpoint conversion surfaces; after compilation cache hits, Graph Capture can again become the longest stage. A single total duration cannot explain all problems.
A public study on vLLM also breaks cold start into six stages and finds that the overall time is mainly limited by the CPU path. GPU memory is allocated quickly, but that does not mean Python, Checkpoint conversion, Kernel compilation, and Graph are finished: Breaking the Ice: Analyzing Cold Start Latency in vLLM.
3. Optimizing the Critical Path in Startup Order
3.1 Step One: Prepare Image and Model Before Requesting GPUs
Having every GPU Pod's Init Container download the model from a remote source is simple to implement, but creates two problems: GPUs sit idle during the download; and N replicas will download N copies of the same weights simultaneously.
A more sensible division of responsibilities is:
English rendering — the original text is retained below.
The node onboarding flow should also complete preparation work in advance:
English rendering — the original text is retained below.
Model cache validation cannot stop at checking whether the directory exists; at minimum the following should be verified:
- Model Digest, configuration, Tokenizer, and weight index;
- All Safetensors shards declared by the index;
- The completion marker is written atomically only after download and validation fully succeed;
- Node disk capacity, quota, eviction policy, and cache location labels.
KServe's LocalModelCache, LocalModelNodeGroup, and LocalModelNode can already pre-download models to node NVMe and track cache status, serving as a public reference for cache controllers: KServe Local Model Cache.
Shared CephFS can hold the authoritative copy, but is not necessarily suitable as the highest-frequency startup disk. When multiple Ranks simultaneously mmap, read, and traverse metadata, the shared file system becomes a common bottleneck. A more robust layering is: shared storage guarantees recoverability, local NVMe guarantees startup speed.
HostPath Is Not NVMe: An On-Site A/B Test
hostPath only means mounting a host directory into the Pod; it does not indicate the underlying disk type. After inspecting two same-spec 8×H20 nodes, we found that the original model HostPath was on the ~1 TiB system root disk; each node also had two ~5.8 TiB NVMe drives, already combined into a ~12 TiB two-disk striped XFS data volume.
After copying ~166.9 GB across 56 files to NVMe, the two nodes took 59 seconds and 58 seconds respectively, including file system sync, with apparent throughput of ~2.7 GiB/s. We then started SGLang Combined TP=8 in parallel on the same model, image, parameters, and GPU spec:
| Observed item | Two-disk NVMe | System root disk | Interpretation |
|---|---|---|---|
| Model Cache Check | Hit | Hit | Neither downloads |
SGLang Load weight |
~246.7 seconds | ~275.8 seconds | NVMe faster by ~29.1 seconds, ~10.5% |
| Decode CUDA Graph | ~26.9 seconds | ~359.1 seconds | JIT Cache state differs between the two nodes; not attributable to storage |
| Pod creation to Ready | ~320 seconds | ~700 seconds | On-site total duration, not a pure storage A/B |
| Deterministic generation request | Correct | Correct | Both return the expected text |
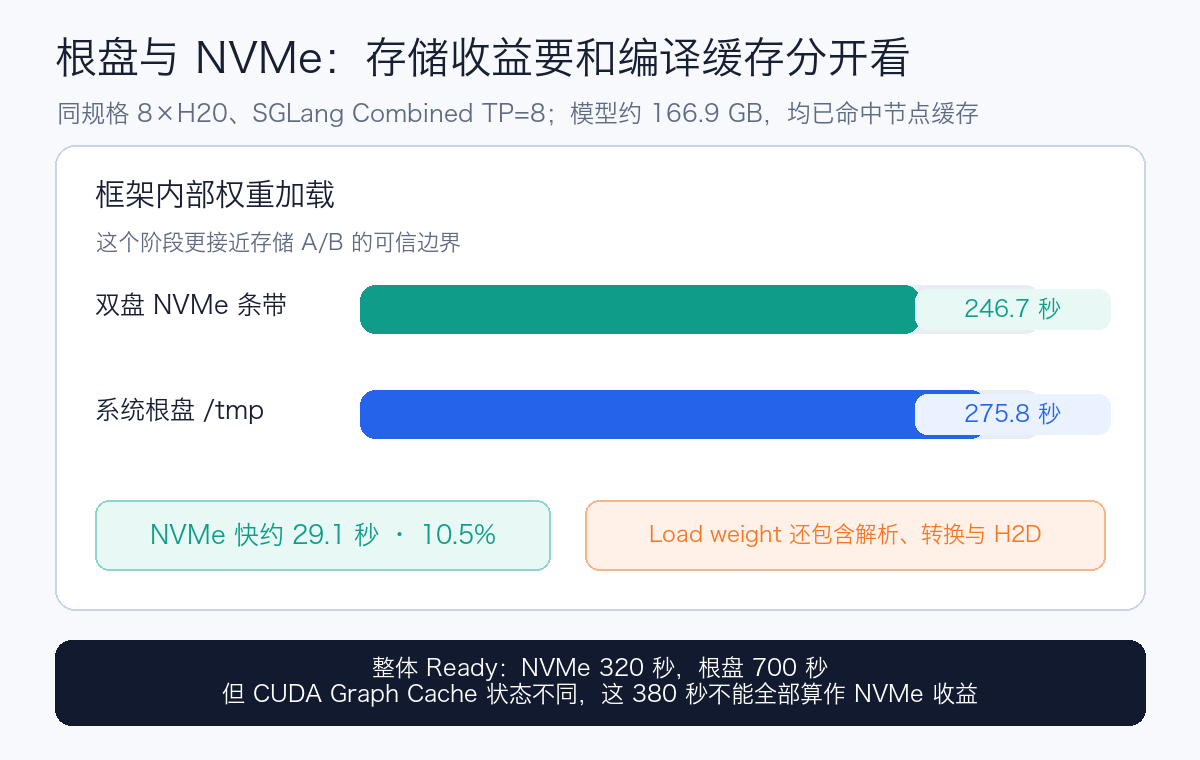
The credible storage conclusion is that the weight stage shortened by ~29 seconds, not that the total shortened by 380 seconds. Although ~167 GB of files can be sequentially copied in about a minute, the Engine's Load weight still took ~247 seconds, indicating it also includes Checkpoint parsing, weight conversion and reordering, FP8/MXFP4 processing, and CPU-to-GPU transfer.
This round did not execute a system-level drop_caches, and the compilation cache states of the two nodes were inconsistent, so it is suitable for confirming direction and magnitude. Before forming capacity commitments, the test should be repeated serially on the same node, measuring cold and hot Page Cache separately, and unifying the JIT Cache fingerprint.
NVMe Is Not Free Acceleration: Confirm Hardware Conditions and Amortization First
"Putting the model on NVMe" only holds when the node actually has suitable local disks, PCIe topology, and remaining capacity. If a cloud instance or bare metal already includes local NVMe, using it may simply activate sunk resources; if upgrading instance specs, purchasing additional local disks, or changing server configuration is required, the 29-second weight gain must be evaluated together with the added cost.
At minimum, the following hardware conditions should be verified:
- Medium and link: whether the disk is truly local NVMe, the PCIe generation, lane count, and actual sequential read bandwidth; the "SSD" label cannot replace actual measurement;
- Topology: NUMA/PCIe distance between NVMe, CPU Socket, and the 8 GPUs; cross-Socket reads may make CPU memory bandwidth and H2D the bottleneck;
- Concurrency capability: a single process copying sequentially is fast, but that does not mean 8 Ranks concurrently mmap-ing, page-faulting, and converting will still reach the nominal bandwidth;
- Capacity: must hold multiple model versions, rollback versions, quantized versions, Draft Models, and compilation caches simultaneously, not just the current model's 156 GiB;
- Endurance and temperature: frequent model updates, cache refills, and image layer writes consume write endurance and may trigger thermal throttling;
- Failure model: a two-disk stripe improves throughput but increases the probability that any single disk failure invalidates the entire cache.
A local model cache can be rebuilt from authoritative storage, so striped disks usually do not need to bear database-style strong consistency and multi-replica costs; but model refill time after disk failure, object storage egress, GPU idle time, and the time for the node to re-enter the serving pool are still availability costs. The cache directory also binds to the node, and the scheduler must be aware of model location; otherwise a Pod may be scheduled to a node without the cache, and the previously purchased local disk performance cannot translate into startup gains.
The economics of NVMe can be estimated using "GPU time saved per startup." Assuming a TP=8 restart shortens by only 29 seconds, the savings are approximately:
English rendering — the original text is retained below.
If a node only restarts a few times per month, upgrading the entire fleet purely for these 29 seconds may have very low return; if the service scales elastically and rolls out frequently every day, or if 29 seconds directly affects the RTO of a high-value service, the benefit is multiplied repeatedly. A more complete judgment should be:
English rendering — the original text is retained below.
Therefore, NVMe is better suited as a tiered cache for high-frequency startup models and critical services, rather than requiring all GPU nodes to be configured indiscriminately with maximum-capacity, highest-spec disks. Low-frequency models can remain on shared storage or be fetched on demand; hot models can be sunk to local disks based on cache hit rate and RTO.
Calculate the Physical Lower Bound First
The pure transfer lower bound for 156 GiB of weights is as follows, not yet including protocol, file system, parsing, conversion, and GPU initialization:
| Effective bandwidth | Theoretical lower bound for moving only 156 GiB |
|---|---|
| 1 Gbit/s | ~22.3 minutes |
| 10 Gbit/s | ~134 seconds |
| 25 Gbit/s | ~54 seconds |
| 3.5 GiB/s NVMe | ~45 seconds |
| 7 GiB/s NVMe | ~22 seconds |
| 14 GiB/s striped NVMe | ~11 seconds |
When download takes 6 minutes, model distribution and caching should be optimized first; once the model is already on local NVMe, continuing to stare at download bandwidth cannot explain the remaining minutes.
3.2 Step Two: Make the Checkpoint Fit the Current Parallel Topology
Safetensors supports safe loading and mmap, but does not guarantee that the original shards fit the current TP, PP, or EP. Common waste includes every Rank traversing all shards, reading in tensors that do not belong to it and then discarding them, and performing quantization, transposition, or Marlin layout conversion only at startup.
The recommended optimization order is:
- Move deterministic quantization, transposition, and weight reordering to offline build;
- Pre-shard according to the target parallel topology, e.g., with TP=8 each Rank directly reads its own contiguous data;
- Use multi-threaded reads and pipelined loading so file reads, CPU conversion, and H2D overlap;
- Choose mmap, eager, or prefetch based on the storage medium;
- Use Loader-internal metrics to distinguish file reads, conversion, and GPU transfer, rather than looking only at total duration.
vLLM's loading configuration includes sharded_state, runai_streamer, runai_streamer_sharded, instanttensor, tensorizer, and modelexpress paths: vLLM LoadConfig. Safetensors' lazy, eager, and prefetch also need A/B testing against local disks or high-latency shared storage: vLLM serve.
SGLang's --weight-loader-prefetch-checkpoints can prefetch the Checkpoint into the OS Page Cache, but it only reduces file waiting; it cannot skip conversion, JIT, or CUDA Graph: SGLang Server Arguments.
GPUDirect Storage only works when hardware, file system, driver, and Runtime Loader all support it, and can reduce CPU Bounce Buffer via DMA. Adding RDMA Resources to a Pod does not automatically enable GDS: NVIDIA GPUDirect Storage.
3.3 Step Three: Turn On-Site Compilation into Fingerprinted Artifacts
When starting DeepSeek V4 SGLang on H20, the process generates CUDA source for sm_90a, then produces CUBIN or dynamic libraries via nvcc, cicc, ptxas, and Ninja.
| Artifact | Typical cache location | On-site observation |
|---|---|---|
| MHC/DeepGEMM Kernel | /root/.cache/sglang/deep_gemm/cache/kernel.<fingerprint>/kernel.cubin |
CUBIN for 16 Buckets |
| SGL Kernel communication extension | /root/.cache/tvm-ffi/sgl_kernel_jit_communicator_<fingerprint>/ |
.so compiled from C++/CUDA |
| CUDA IPC and Triton extension | /root/.cache/tvm-ffi/, /root/.cache/sglang/triton/ |
Runtime auxiliary .so |
| FlashInfer | /root/.cache/sglang/.cache/flashinfer/<version>/<arch>/ |
Version- and architecture-dependent Kernel Cache |
| vLLM torch.compile | $VLLM_CACHE_ROOT/torch_compile_cache/ |
Inductor, Triton, and AOT artifacts |
One MHC Prewarm generates 16 CUBINs in about 248 seconds, while the final files are under 1 MiB. This cost should be moved from every Pod startup to a controlled prewarm or image build stage. vLLM also recommends persisting or copying VLLM_CACHE_ROOT; otherwise, merely saving the Hugging Face weight cache still triggers recompilation: vLLM Docker Deployment, vLLM Startup Optimization.
Compilation caches cannot be blindly reused across environments; the fingerprint should include at least:
English rendering — the original text is retained below.
Recommended build flow:
English rendering — the original text is retained below.
If /root/.cache is overwritten entirely by emptyDir, the precompiled artifacts in the image will also be shadowed. They should be copied to a writable volume, or only the subdirectories that need persistence should be mounted. Correctness regression is still required after a cache hit, because incorrect artifacts can cause crashes or wrong tokens.
SGLang also provides SGLANG_JIT_DEEPGEMM_PRECOMPILE, parallel compilation workers, and Fast Warm-up. Fast Warm-up may shorten startup but sacrifices steady-state performance; correctness, throughput, and tail latency should be compared simultaneously: SGLang Environment Variables.
3.4 Step 4: Reduce the Shape Set for CUDA Graph and Warm-up
After a compilation cache hit, CUDA Graph often becomes the next critical path. In this round, Target and Draft captures together took about 517 seconds. Graphs are tied to process GPU memory addresses, communicators, and shapes, and cannot be simply copied to another process like CUBINs.
A more feasible strategy is to control shapes rather than disable Graphs entirely:
- Use real traffic concurrency, input and output lengths to determine the capture set;
- Limit
max-num-seqsor the equivalent maximum number of requests; - Time Target-only, Speculative Draft, and different configurations separately;
- Let low-frequency large shapes run Eager first, and complete Capture in the background;
- Distinguish between two levels of Readiness: "minimum serviceable" and "all target shapes prewarmed".
vLLM's -O0 through -O3 reflect an explicit trade-off between startup time and steady-state performance, and are suitable as A/B variables rather than using --enforce-eager to mask the problem long-term: vLLM Optimization Levels.
3.5 Step 5: Define Business Readiness with Real Requests
The minimum acceptance criteria cannot stop at the TCP port or /health=200. At minimum, verify:
/v1/modelsreturns the expected model;- A generation request with a fixed prompt and fixed sampling parameters returns deterministic results;
- Common shapes have completed prewarming;
- The Gateway only admits traffic after the above conditions pass;
- When a new replica fails, the old replica or Combined replica can continue serving.
This step does not make the Engine load faster, but it prevents mistaking "port ready, first request compiles on the spot" for completed cold start.
4. When Ordinary Load Optimization Is Exhausted: Directly Reusing Existing State
After completing NVMe, Checkpoint, compilation cache, and Graph optimization, the next step is no longer reading files faster, but reusing another instance of already-loaded or initialized state.
4.1 GPU Peer Copy: Suitable for Scale-out and Rolling Releases
NVIDIA ModelExpress preferentially copies GPU weights from compatible existing replicas via NIXL and P2P RDMA; when no peer is available, it falls back to object storage streaming load, GDS, or the POSIX Loader. It can also transfer Triton, DeepGEMM, TileLang, CuTe DSL, and FlashInfer Kernel Caches.
In public benchmarks, approximately 806 GiB DeepSeek-V4-Pro with TP=8, 8×B200 and ConnectX-7 achieves P2P weight loading in about 11 seconds; after reusing Kernel Artifacts, API Ready dropped from about 8 minutes to 1 minute 44 seconds. The starting point is that a compatible replica already exists; this cannot be taken as a promise of full cold start from remote storage on H20: ModelExpress Benchmark, Deployment Notes.
This speed is also not free. GPU Peer copy includes at least the following costs:
- Source replica cost: A compatible, accessible weight source that has not exited must be retained; keeping 8 GPUs resident for on-demand scale-out may be more expensive than waiting for local loading;
- Network hardware cost: RDMA NICs, high-speed switches, optical modules, cabling, and lossless network configuration all carry procurement and operations costs;
- Topology constraints: Source and target must satisfy GPU model, Runtime, model digest, parallel topology, and Kernel Cache fingerprint compatibility, reducing scheduling freedom;
- Bandwidth contention: Model copying may share the network with online inference KV transfer, training jobs, and storage traffic; faster scale-out does not mean safer for the production network;
- Failure coupling: If all new replicas depend on the same source instance, a source replica or network failure amplifies scale-out failures; an object storage or POSIX fallback path must be retained;
- Software complexity: Transfer orchestration, authentication, validation, timeouts, fallback, observability, and version compatibility all require ongoing maintenance.
P2P is best suited for rolling releases and burst scale-out when stable replicas already exist. If a group of idle GPU peers is kept resident long-term for occasional scale-out, or the network must be upgraded wholesale, keeping a small number of Combined hot replicas, using node NVMe, or even accepting a few minutes of loading time may be more economical. When evaluating, record source replica GPU utilization, copy bandwidth consumption, scale-out frequency, fallback rate, and GPU·minutes saved per scale-out event.
4.2 Sleep Mode: Trading Host Memory for Wake-up Speed
vLLM Sleep Mode retains the process, offloads weights to CPU memory, discards the KV cache, and restores via wake-up. It avoids Python initialization and recompilation, but consumes significant Host Memory and cannot solve recovery after a Pod or node disappears: vLLM Sleep Mode.
4.3 GPU Snapshot: Second-level, but Not Ordinary Cold Start
NVIDIA Dynamo Snapshot uses CRIU and cuda-checkpoint to save the process, CUDA Context, and GPU state. The officially published gpt-oss-120b prototype achieves under 5 seconds, about 21× speedup, but the project is still marked as early development and not production-ready; multi-GPU, multi-node, driver compatibility, and privileged Node Agents all require validation: Dynamo Snapshot, Prototype Notes, Kubernetes Limitations.
ServerlessLLM at OSDI 2024 used local Checkpoints, optimized formats, multi-tier storage, and locality-aware scheduling to reduce model loading latency across multiple model classes by 10–200×; however, sub-second numbers for small models cannot be linearly extrapolated to a 156 GiB DeepSeek: ServerlessLLM.
5. Realistic Targets: From Half an Hour to Which Level
Combining on-site measurements, byte-level lower bounds, and public results, tiered targets can be established for a 156 GiB-class model:
| Scenario | Time Magnitude | Nature |
|---|---|---|
| Remote model, image, and compilation cache all miss | 10–30 minutes; on-site about 23–30 minutes | Full cold start |
| Model hits the node, but on-site conversion, JIT, and Graph | About 7 minutes 40 seconds to 11 minutes | Validated baseline |
| NVMe + pre-sharding + compilation cache + converged Graph | 2–5 minutes | Current reasonable engineering target |
| Streaming Loader, GDS, or sufficient pipelining | 45–120 seconds | Aggressive path, depends on hardware and Runtime |
| Compatible GPU Peer already exists | Public B200 result 1 minute 44 seconds Ready | Scale-out, not first startup |
| Hot replica, Sleep, or GPU snapshot | Seconds to tens of seconds prototypes exist | Hot recovery, not true cold start |

For the existing H20 environment, the reasonable order is: first stabilize in the 2–5 minute range, then evaluate P2P to break under two minutes; critical services use prewarmed replicas or snapshots to push failover to seconds. Full cold start time cannot directly become the business RTO.
5.1 Not Pursuing the Most Expensive Hardware, but the Lowest Total Cost That Meets the SLO
Different solutions address different bottlenecks, and costs land in different places:
| Solution | Primary Benefit | Primary Cost | Better Suited For | Cases Where Direct Adoption Is Not Suitable |
|---|---|---|---|---|
| Shared storage or object storage source | Centralized capacity, unified model versions | Startup bandwidth and latency, traffic storms | Low-frequency models, authoritative copies | High-frequency scaling, strict RTO |
| Node NVMe cache | Reduces model read wait, reduces shared storage pressure | Local disk capacity, instance premium, cache amplification and node binding | Hotspot models, rolling releases | Rare startups or bottleneck already in JIT/Graph |
| Pre-sharding and streaming Loader | Reduces invalid reads and conversion, fully utilizes existing hardware | Additional model artifacts, build pipeline and compatibility testing | Fixed topology, stable model versions | Frequently changing topology, weak version governance |
| Precompiled Kernel Cache | Eliminates on-site compilation | Artifact matrix, compatibility fingerprints, and correctness risk | Production environments with controlled Runtime versions | Frequent image and dependency drift |
| RDMA/GPU P2P | Extremely fast scale-out, reuses weights in GPU | Resident source replicas, high-speed network, and complex transfer control plane | High-frequency scaling, rolling releases, strict RTO | Infrequent scaling, high network upgrade cost |
| Hot replicas | Most direct failover, predictable behavior | Continuous GPU occupancy | High-value, low-fault-tolerance services | Low traffic, cost-sensitive models |
| Sleep or GPU Snapshot | Second-level wake-up or recovery | Host Memory, privileged components, compatibility and maturity | Controlled environments, well-defined recovery scenarios | Need for general disaster recovery or cross-version recovery |
Answer three questions before selecting:
- Is the current longest phase model transfer, weight conversion, JIT, or Graph?
- Does the business actually require full cold start of new nodes, rolling releases, or failover RTO?
- How many times per month will this optimization be triggered, and how many GPU·minutes and failure losses does it save?
If JIT and CUDA Graph account for 8 minutes, upgrading the disk from 3 GiB/s to 7 GiB/s may only save tens of seconds; in that case, precompilation is more effective than buying a more expensive disk. If rolling releases happen multiple times per day and online replicas already exist, the P2P network investment may amortize quickly; if scaling happens only a few times a year, keeping a resident source GPU group may not be justified.
The final target should be written as an SLO with cost constraints, for example "P95 Ready within five minutes when the node cache hits, with monthly additional infrastructure cost not exceeding a certain budget," rather than "all models use the highest-spec NVMe and RDMA."
6. Implementation Roadmap: Change Only One Variable per Round
6.1 First Fill the Gap in Segmented Observability
Each Pod should output structured startup events:
{"stage":"model_cache_check","elapsed_ms":1234,"cache_hit":true}
{"stage":"weight_load","elapsed_ms":246700,"bytes":166900000000}
{"stage":"kernel_jit","elapsed_ms":248231,"cache_hit":false}
{"stage":"cuda_graph","elapsed_ms":356020,"shape_count":51}
{"stage":"business_ready","elapsed_ms":663104}
Prometheus should record at least creation-to-Ready, per-stage histograms, model and compilation cache hit rates, bytes read and throughput, and TTFT of the first real request. P95 matters more than the single fastest value.
6.2 Proceed with Four Rounds of A/B Testing
| Round | Sole Variable | Question to Answer |
|---|---|---|
| A | Remote source → Node NVMe | How much duplicate download is eliminated |
| B | Default loading → Pre-sharding, parallel, or streaming Loader | How much read, conversion, and H2D time is reduced |
| C | Empty compilation cache → Same-fingerprint precompiled cache | How much JIT and Autotune is eliminated |
| D | Full-shape Graph → Real-traffic shapes | How much Capture time is reduced, and whether steady-state performance is maintained |
Each round must fix the model digest, Runtime image, TP, context, quantization, and sampling parameters, and simultaneously compare: startup time, correctness, throughput, TTFT, TPOT, GPU memory, and power consumption. Faster cold start with significantly degraded steady-state performance is not a free optimization.
6.3 Finally Evaluate the Extreme Paths
Only after ordinary loading is stable in the 2–5 minute range, then validate:
- Whether GDS or streaming Loader truly opens the target data path;
- P2P weight and Kernel Cache copying between same-GPU-model replicas;
- Sleep Mode's Host Memory cost and wake-up time;
- Whether GPU Snapshot is usable with TP=8, the current Runtime, and security policies;
- Whether the GPU cost of resident standby replicas is lower than the business loss of a half-hour failure window.
7. Conclusion
Starting from the DeepSeek-V4-Pro rolling restart taking nearly half an hour, we initially focused only on model download; only after segment-by-segment observation on DeepSeek V4 Flash did we confirm that the model cache solves only the first segment. Checkpoint layout, GPU transfer, on-site JIT, CUDA Graph, and real-request warm-up can each become the critical path in turn.
What ultimately needs to be managed is not a single startup parameter, but three categories of reusable assets:
- Model assets: immutable digests, node NVMe caches, Checkpoints oriented to parallel topology;
- Runtime assets: CUBINs with compatibility fingerprints,
.so, Triton, DeepGEMM, TileLang, FlashInfer, and torch.compile caches; - Running-state assets: prewarmed replicas, GPU peers, sleeping processes, or validated snapshots.
For the ordinary H20 path, bringing node-cache restarts to 2–5 minutes is a reasonable and verifiable target; second-level times must rely on hot replicas, Sleep, or GPU snapshots, and should honestly be called recovery rather than full cold start.
Further reading:
- Large Model Weight Distribution and Loading Acceleration: Community and Commercial Solution Selection: horizontal selection of object storage, parallel file systems, P2P, node caches, and Loaders;
- Large Models and Data Artifacts: model distribution, node caches, OCI artifacts, and supply chain;
- DeepSeek-V4-Flash-0731 H20 Deployment and Load Testing: itemized startup logs, deployment configuration, and throughput baseline.