What AIBrix Routing Actually Optimizes: From Cache Hit to Tail Latency
Qwen3.8-27B is a 27-billion-parameter dense vision-language model with a hybrid architecture combining Gated DeltaNet and Gated Attention, with official FP8 weights. This test uses Qwen3.8-27B-FP8, two vLLM replicas, one L20 per replica, text-only, 32K context, MTP disabled. The focus here is multi-replica request distribution, not comparing model answer quality or multimodal capabilities. Official model documentation
AIBrix targets inference services on Kubernetes, providing model-aware routing, scaling, and other capabilities. Simply connecting Prometheus and displaying Token/s only proves the observability pipeline works. To answer whether it improves the service, you must connect what routing did, how much computation the engine actually saved, and how long users waited.AIBrix overview
Imagine two customer service agents jointly handling eight product manuals. Random assignment means both agents may repeatedly flip through the same book; assignment by in-flight request count prioritizes finding the person with fewer tasks at hand; prefix routing tries to find the person who has already read that book. But if nine out of ten questions come from the same book, this "agent familiar with the business" may also end up in a long queue.
This test controls the initial cache state and uses three strategies to answer three questions: Does cold start avoid duplicate Prefill? How much benefit remains when both agents have read the manuals? After hot spots concentrate, does the saved computation outweigh the queuing?
Completed 24 formal phases, 2,304 actual requests, 2,304 fully successful, 0 failures, 0 client-side drops. This test does not rank strategies by hit rate: benefits in a cold cache fluctuate; even when both engine sides are warm, the routing index can skew; hot spots further expose the trade-off between cache locality and queuing.
1. First, Distinguish the Two Cache Ledgers

This test uses AIBrix v0.7.0, with character tokenizer, 128-character chunking, 200K index blocks; KV event sync is disabled. This is a local prefix index maintained from request history: when the router selects a replica, it records that this prefix was sent there, without waiting for the engine to report "this KV segment is now reusable." It helps locate replicas that may hit, but cannot directly prove the engine cache is still present. v0.7.0 prefix routing implementation
| Question to answer | Evidence | What it cannot replace |
|---|---|---|
| Why did AIBrix choose this replica? | Increment of routing_selection_total, grouped by selection |
Cannot be treated as actual engine hit count |
| How similar does the router think the prefix is? | routing_decisions_total of match_percent_bucket |
Character match ratio is not token hit rate |
| Where did the request actually go? | Response header target-pod, recorded per entry then replaced with replica alias |
Number of occurrences of a replica in the full log is not per-request attribution |
| How much input did the engine actually reuse? | Phase increment of vllm:prefix_cache_hits_total / queries_total |
Token ratio is not request hit rate |
| Does saved Prefill improve experience? | Wait queue, TTFT, TPOT, full stream success and requests meeting the criteria | GPU utilization or average throughput alone cannot answer this |
The engine log for the current hybrid model shows attention blocks aligned at 1,568 tokens; this is a different unit level from the router's 128-character blocks. Input is about 5K tokens; even if the shared body is already warmed, trailing incomplete blocks and varying questions still need processing, so token hit rate cannot be expected to necessarily reach 100%.
2. How the Three Strategies Actually Select
random selects randomly from available replicas; least-request compares real-time in-flight request counts maintained by the gateway; prefix-cache first looks for a matching prefix, then is constrained by load conditions. All run on the same AIBrix entry point, switched via request header routing-strategy, with identical model service configuration. Therefore, this comparison is between AIBrix internal strategy choices, not the overall overhead of "using AIBrix" versus "completely bypassing AIBrix."
After the model is registered in AIBrix, routing can be selected and response headers observed as follows; request.json uses the request fields below, with URL and authentication filled in per your own environment:
curl -iN "${AIBRIX_URL}/v1/completions" \
  -H 'Content-Type: application/json' \
  -H 'routing-strategy: prefix-cache' \
  --data-binary @request.json
Change the header value to random or least-request to switch to the other two strategies. The -i shown by target-pod is the basis for recording actual destinations in this test. Sending only these three example requests consecutively does not constitute a fair load test; you must also isolate the initial cache and arrival sequence per the steps below.
The actual prefix routing configuration in this test is:
AIBRIX_PREFIX_CACHE_TOKENIZER_TYPE: character
AIBRIX_PREFIX_CACHE_BLOCK_SIZE: "128"
AIBRIX_PREFIX_CACHE_POD_RUNNING_REQUEST_IMBALANCE_ABS_COUNT: "16"
AIBRIX_PREFIX_CACHE_STANDARD_DEVIATION_FACTOR: "2"
AIBRIX_PREFIX_CACHE_KV_EVENT_SYNC_ENABLED: "false"
The above is the configuration read in the experimental environment, not a recommended default for all clusters to copy. The v0.7.0 local index branch first checks the difference between maximum and minimum in-flight counts; when it exceeds 16, matching candidates are restricted to the most idle replica. It then sorts by prefix match degree, with ties broken by smaller in-flight count; load filtering uses 在途数 ≤ 平均值 + 2 × 标准差, falling back to least-request when no candidate can be selected. Actual selection logic
There is an easily overlooked two-replica characteristic here: for two load counts, the upper bound of 平均值 + 2 × 标准差 is sufficient to accommodate the larger count. Therefore, under this parameter set, this filter condition will not proactively exclude the busier replica; the absolute difference threshold and the in-flight ordering when match degrees are equal deserve more attention. This is a boundary derived from source code conditions, and does not mean it holds for all replica scales, parameters, and versions.
Also distinguish between gateway in-flight count and vllm:num_requests_running. The engine setting max-num-seqs=8 does not mean the gateway has at most 8 in-flight requests: requests waiting at the engine may also still be incomplete. You cannot assert from this that "a difference of 16 will never trigger."
3. How to Establish a Comparable Initial State
| Condition | This test's approach |
|---|---|
| Hardware | Two fixed nodes, one single-L20 replica each; nodes shared with other workloads |
| vLLM | Container version 0.26.0b2.dev1+g3b102b576, not using image tags as a substitute for actual version |
| Engine capacity | max-model-len=32768, max-num-seqs=8, max-num-batched-tokens=8192 |
| Cache | FP8 KV, GPU memory utilization 0.90, Prefix Cache / Chunked Prefill enabled |
| Each phase | 96 scheduled arrivals, 1.6 RPS, fixed 128-token output, client in-flight cap 48 |
| Repetition | Two rounds; first round random → least-request → prefix-cache, second round reversed |
| Request order | Same prefix category sequence per strategy within a round; seeds 102 and 103 respectively |
| Observation | Per-stream time and actual target replica; engine before/after counters; 5-second engine snapshots; Prometheus / Grafana |
First warm up the engine compute shapes with concurrency 1 / 4 / 8, then wait for both engines to be idle, call the cache reset endpoint one by one and check success=true. Each phase uses a different salt placed before the first block for each prefix group; v0.7.0 uses chained prefix hashing, so this isolates routing records from previous phases without restarting the shared gateway. Prefix hash implementation
The initial states of the four scenarios are as follows.
| Scenario | Engine KV initial state | Routing index initial state | Formal request composition |
|---|---|---|---|
| cold-uniform | Both sides cleared, no formal prefixes warmed | New prefixes, no history | Eight groups of 12 each |
| warm-uniform | Eight prefix groups warmed on both sides | Records established via a shared prefix-cache bootstrap step | Eight groups of 12 each |
| hot50 | Each measured prefix initially on one side only, four groups on A/B each | Records its initial assignment | Hot group 48 requests, remaining total 48 requests |
| hot90 | Same as above | Same as above | Hot group 86 requests, i.e., 89.6%; remaining total 10 requests |
Hot spot initialization first sends 16 candidate prefixes via prefix-cache, twice each, and verifies both land on the same replica; then four groups are selected from each side for formal measurement. All strategies use the same initialization rules, with selection based solely on initial assignment, not filtered by test latency. Unselected candidates still occupy initial cache, so this cannot be described as "only eight documents in the cache." Each phase saves candidate assignment and logical group mapping; hot spot initialization is always set on the replica on the L20-B node, not cross-rotated between the two nodes; specific GPU device numbers were not pinned during container rebuilds.
warm-uniform deliberately has KV on both engine sides, while the routing index still comes from shared historical requests. This allows us to distinguish "the engine is inherently warm" from "the router knows which locations may be warm," without conflating the two.
Prompt and Full Stream Definition
The actual Prompt structure is:
English rendering — the original text is retained below.
<256 hexadecimal characters: a different salt per stage and per document>
Document <document number>
The service tracks request latency, token throughput, cache utilization, and healthy replicas.
...repeat the above sentence 300 times...
Question <six-digit request number>: Explain the operational tradeoffs in detail.
The salt stays consistent within the same group, and the trailing question number varies per request. Different salts have slightly different token counts; per-request usage records the actual input length. What is controlled here is the load structure, not a claim that every input has exactly the same token count.
Call /v1/completions, setting temperature=0, ignore_eos=true, stream=true, stream_options.include_usage=true. A formal request counts as successful only if it returns HTTP 200, receives content, receives [DONE], and usage shows exactly 128 output tokens. No automatic retries.
- TTFT: from POST start to first content chunk, including client-to-entry overhead.
- TPOT:
(最后内容时间 − 第一段内容时间) / 127, the average generation interval per request; not a per-token latency distribution. - Passing: full stream succeeds, and TTFT ≤ 2 seconds, TPOT ≤ 150 milliseconds, E2E ≤ 30 seconds all hold simultaneously.
- Pass rate: passing requests / 96 scheduled arrivals; arrivals not sent by the client cannot be removed from the denominator.
Per-phase P95 is computed from raw successful requests using linear interpolation. The two rounds are shown separately; the two P95 values cannot be averaged and called a combined P95. Grafana's one-minute sliding histogram estimates are used to observe the change process and differ in definition from exact per-round quantiles.
4. Cold vs. Warm Cache Comparison
| Scenario / Round | Strategy | TTFT P95 s | TPOT P95 ms | Token hit rate | Passing / 96 | A / B requests |
|---|---|---|---|---|---|---|
| Cold / 1 | random | 7.689 | 90.8 | 77.7% | 40 | 45 / 51 |
| Cold / 1 | least-request | 7.673 | 106.1 | 77.7% | 43 | 48 / 48 |
| Cold / 1 | prefix-cache | 5.575 | 81.4 | 85.4% | 59 | 36 / 60 |
| Cold / 2 | random | 9.229 | 73.3 | 78.0% | 28 | 47 / 49 |
| Cold / 2 | least-request | 6.422 | 84.5 | 77.7% | 48 | 47 / 49 |
| Cold / 2 | prefix-cache | 9.049 | 66.1 | 85.4% | 40 | 60 / 36 |
| Both warm / 1 | random | 0.625 | 59.8 | 93.1% | 96 | 46 / 50 |
| Both warm / 1 | least-request | 0.325 | 58.5 | 93.2% | 96 | 46 / 50 |
| Both warm / 1 | prefix-cache | 0.325 | 59.3 | 93.1% | 96 | 48 / 48 |
| Both warm / 2 | random | 1.975 | 60.0 | 93.2% | 91 | 54 / 42 |
| Both warm / 2 | least-request | 0.327 | 58.5 | 93.2% | 96 | 50 / 46 |
| Both warm / 2 | prefix-cache | 9.692 | 60.4 | 93.1% | 43 | 70 / 26 |
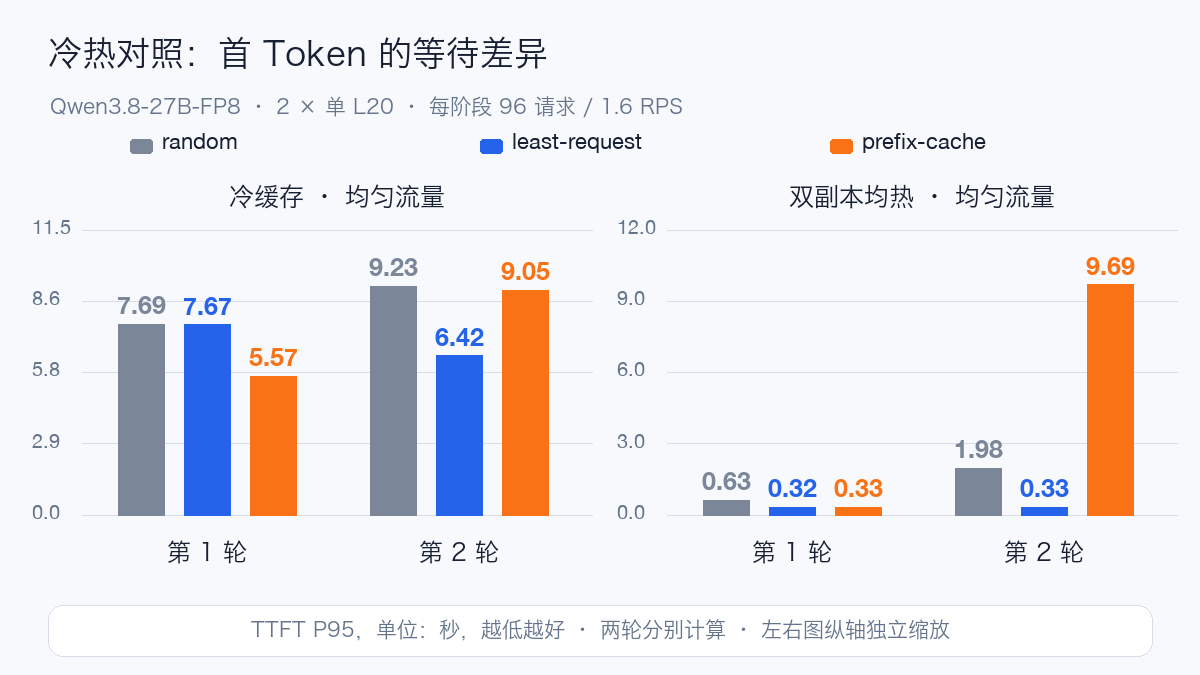
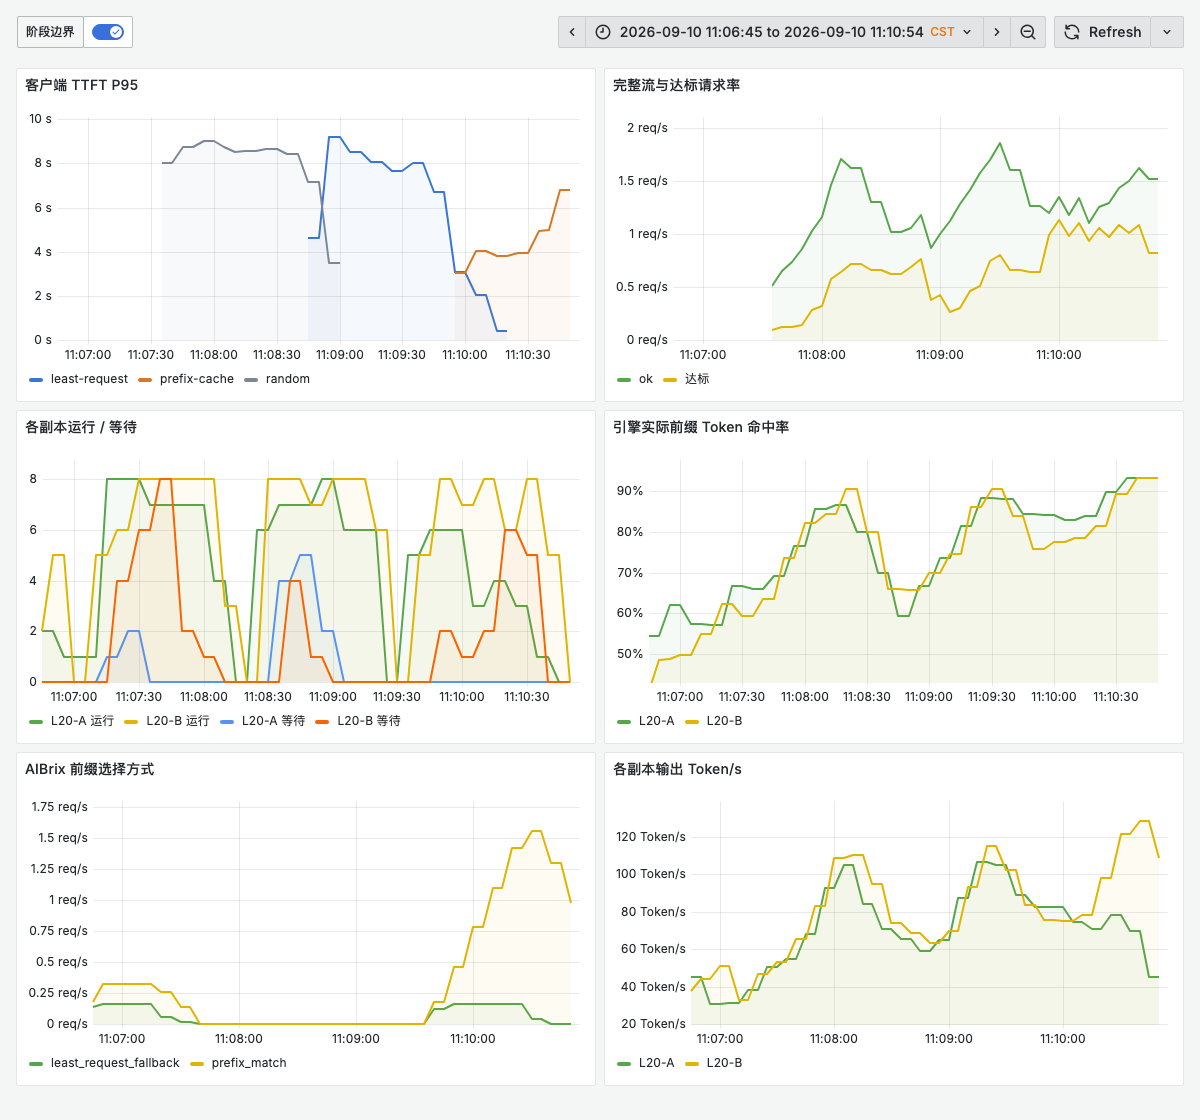
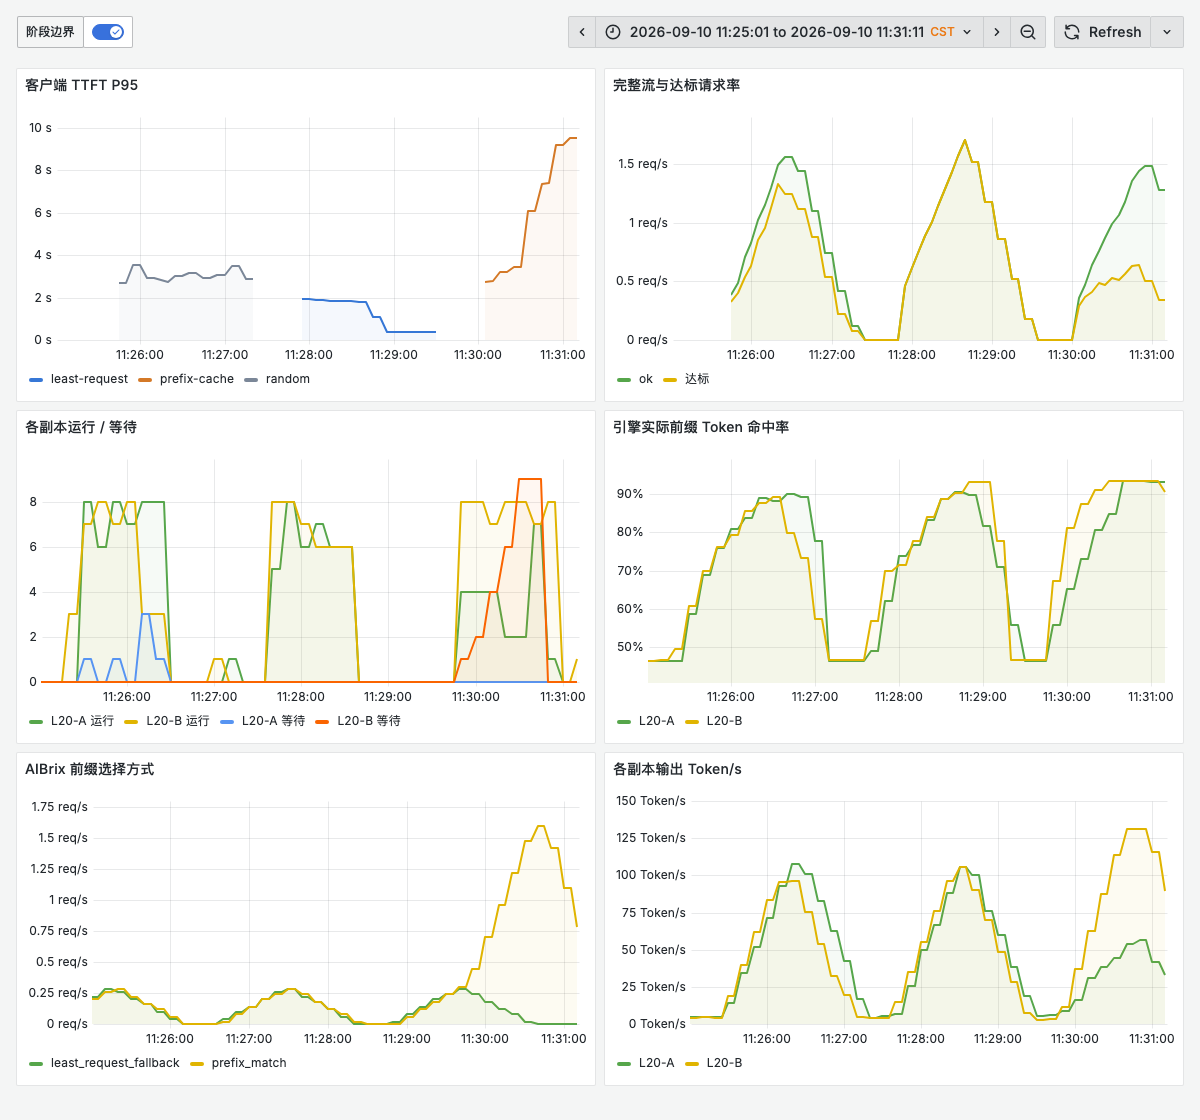
In the first round of cold cache, prefix-cache achieved a hit rate of about 85.4%, higher than the other two strategies' 77.7%, with a lower TTFT P95 as well. But in the second round, prefix-cache's TTFT P95 was 9.049 seconds, least-request was 6.422 seconds, and random was 9.229 seconds. Similar hit rates do not imply similar tail latencies.
The cold cache phase did not pre-force an even 4-4 distribution of the eight prefix groups. In the first round, prefix-cache split requests 36 / 60; in the second round, 60 / 36; in the second round, A's five-second wait snapshot peaked at 9, B at 0. Initial prefix placement, arrival order, and the shared environment may all affect results; two rounds of data are insufficient to determine which single factor contributes the most.
Both Engine Sides Warm, Routing Index Can Still Skew
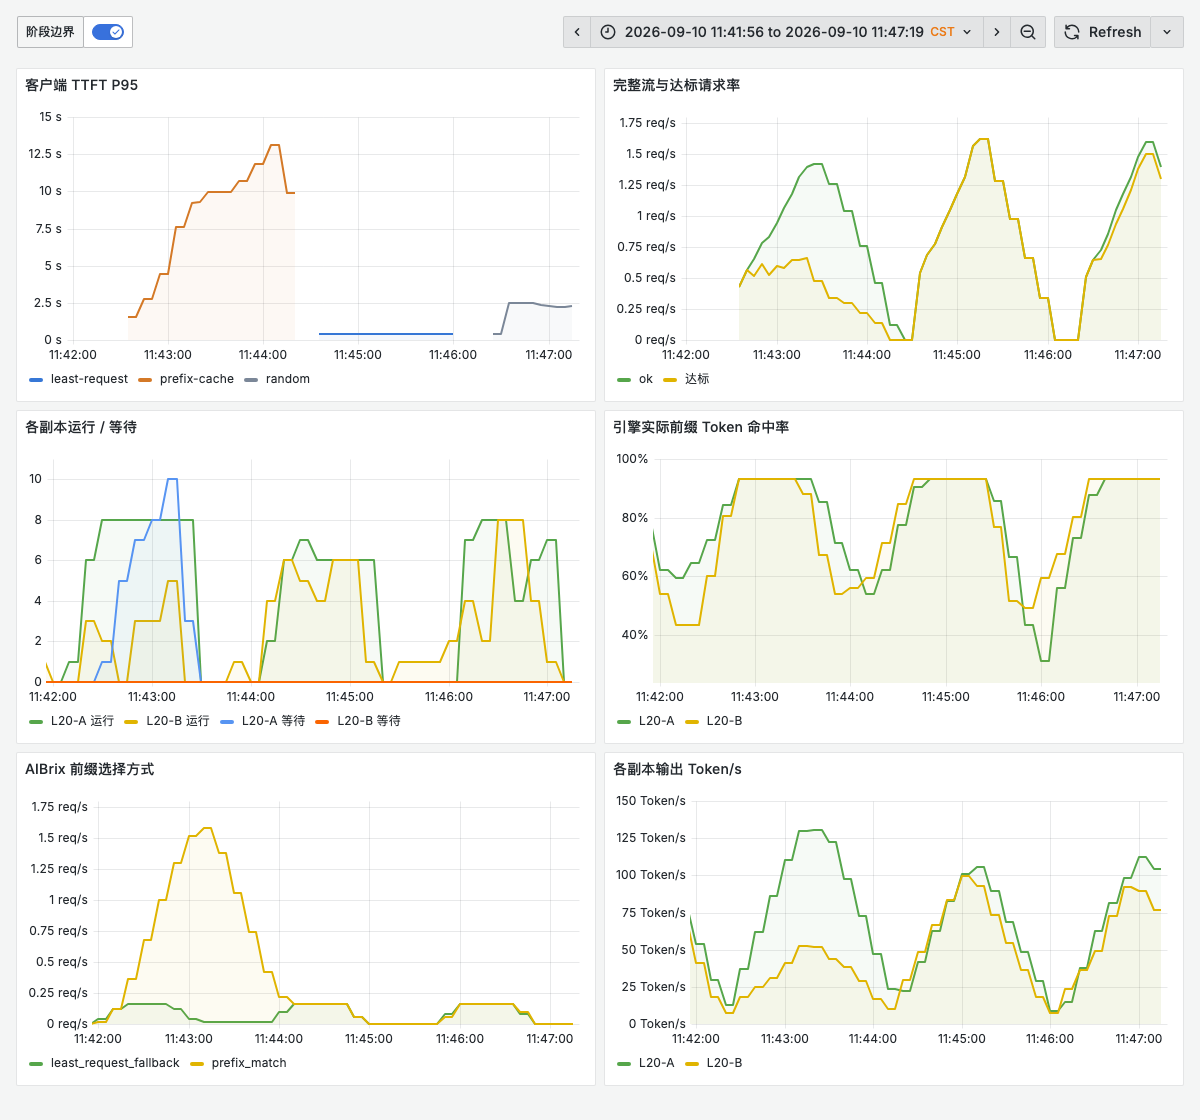
In the first round of warm-uniform, all three strategies achieved 96/96 passing, with prefix-cache's initial index assigning four groups to A and four to B. But in the second round of prefix-cache, the engine KV was still warm on both sides, yet the routing initial index assigned six groups to A and two to B, resulting in a final distribution of 70 / 26; the actual token hit rate was about 93.1%, TTFT P95 reached 9.692 seconds, and only 43/96 passed. This phase recorded one protection event and one fallback, with A's five-second wait snapshot peaking at 9.
This is equivalent to both customer service agents actually having read all the manuals, but the front desk register only recorded A for six of the books, so requests were still concentrated on A. Directly warming the engine does not automatically let the local history index know all the locations that can hit. KV event sync was not enabled in this test, so this phenomenon cannot be extrapolated to behavior with event sync enabled.
warm-uniform controlled engine KV availability, but the routing bootstrap step did not force a 4-4 index distribution, so the difference between the cold and warm groups is not a pure single-variable benefit estimate of "only changing the KV initial state." It simultaneously demonstrates strategy sensitivity to index layout. The hot spot experiment additionally fixed the 4-4 initial assignment; this distinction must be preserved when reading the tables.
This experiment uses a fixed 1.6 RPS arrival load, not unlimited pressure testing to find throughput ceilings. In the first round of cold cache, output throughput over the full measurement interval (including tail drain) was random 184.6, least-request 184.7, prefix-cache 171.8 Token/s. Lower TTFT cannot be interpreted as all throughput metrics also improving; full values are stored in the result JSON.
There is also a definitional boundary in the cache metric: in the second round of cold cache, the client-side input usage total for random was 484,608 tokens, while the engine prefix_cache_queries_total increment was 494,703 tokens. The in-container code records query tokens when querying already-computed blocks, not deduplicating unique client input. Therefore, this document calls it "token cache query hit rate" and does not multiply it by request count to infer how many requests hit. Client, gateway, and engine completion counts are all 96, with no client retries observed.
5. Hotspot: Cache Locality vs. Queueing Trade-offs
| Scenario / Round | Strategy | TTFT P95 s | TPOT P95 ms | Token Hit Rate | Met / 96 | A / B Requests |
|---|---|---|---|---|---|---|
| 50% hotspot / 1 | random | 2.844 | 82.4 | 85.3% | 78 | 52 / 44 |
| 50% hotspot / 1 | least-request | 1.767 | 71.6 | 85.4% | 96 | 48 / 48 |
| 50% hotspot / 1 | prefix-cache | 8.317 | 59.8 | 93.3% | 38 | 27 / 69 |
| 50% hotspot / 2 | random | 5.990 | 81.7 | 85.4% | 63 | 39 / 57 |
| 50% hotspot / 2 | least-request | 1.907 | 81.9 | 85.4% | 94 | 47 / 49 |
| 50% hotspot / 2 | prefix-cache | 8.279 | 59.9 | 93.1% | 37 | 27 / 69 |
| 89.6% hotspot / 1 | random | 5.578 | 71.5 | 87.3% | 76 | 42 / 54 |
| 89.6% hotspot / 1 | least-request | 1.771 | 70.3 | 87.4% | 96 | 47 / 49 |
| 89.6% hotspot / 1 | prefix-cache | 6.535 | 59.9 | 92.2% | 68 | 38 / 58 |
| 89.6% hotspot / 2 | random | 3.547 | 70.8 | 88.3% | 78 | 53 / 43 |
| 89.6% hotspot / 2 | least-request | 1.255 | 82.2 | 88.2% | 96 | 48 / 48 |
| 89.6% hotspot / 2 | prefix-cache | 8.001 | 59.8 | 92.4% | 61 | 38 / 58 |
Evidence chain for the 50% hotspot
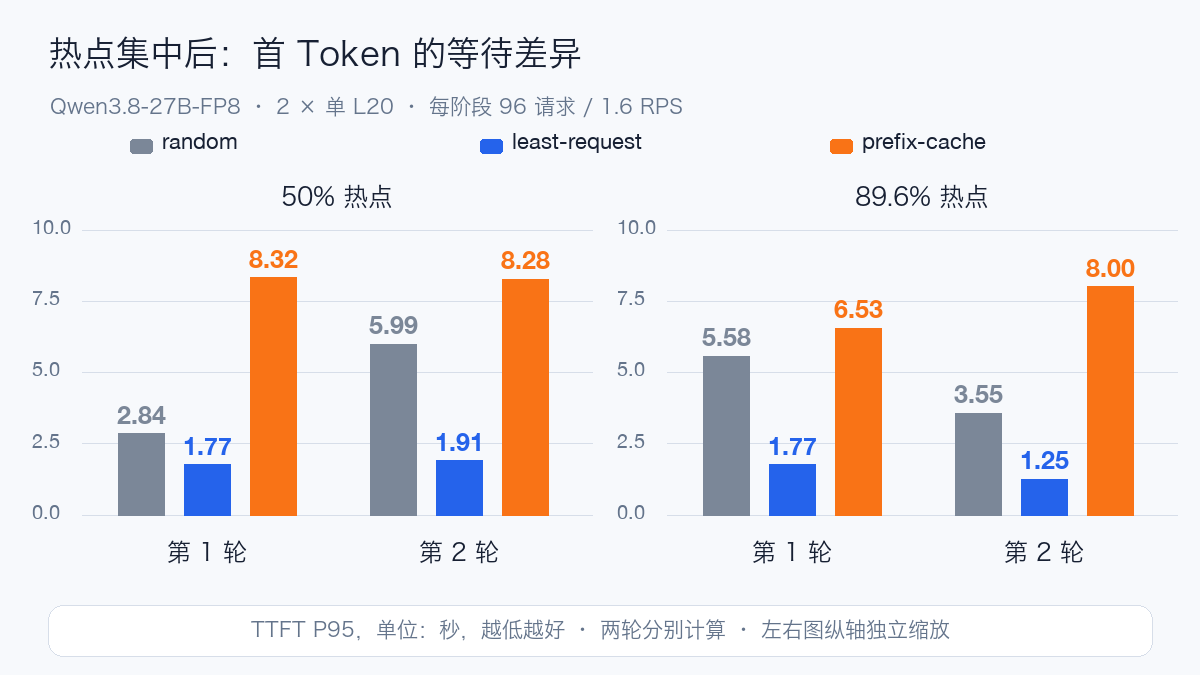
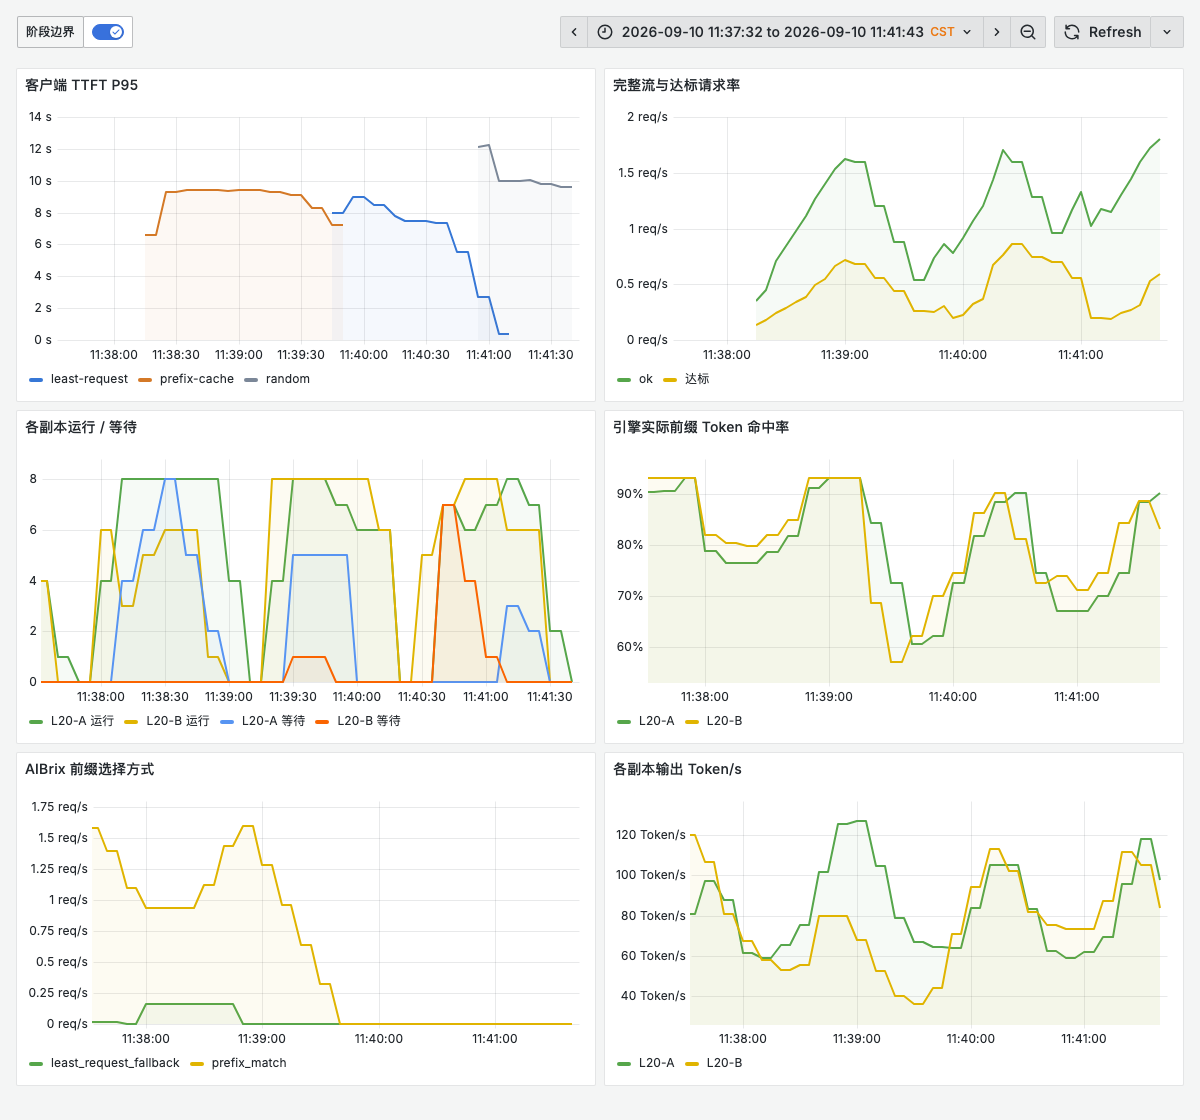
In round one, prefix-cache had 96 prefix_match with an actual token hit rate of 93.3%, but only completed 38/96 requests meeting the SLO. Per-request response headers show A received 27 and B received 69: B held the 48 requests from the hotspot group plus 21 from the remaining three groups, forming exactly the 69-request concentration. Engine completion counts were 27 / 69, consistent with both client and gateway logs.
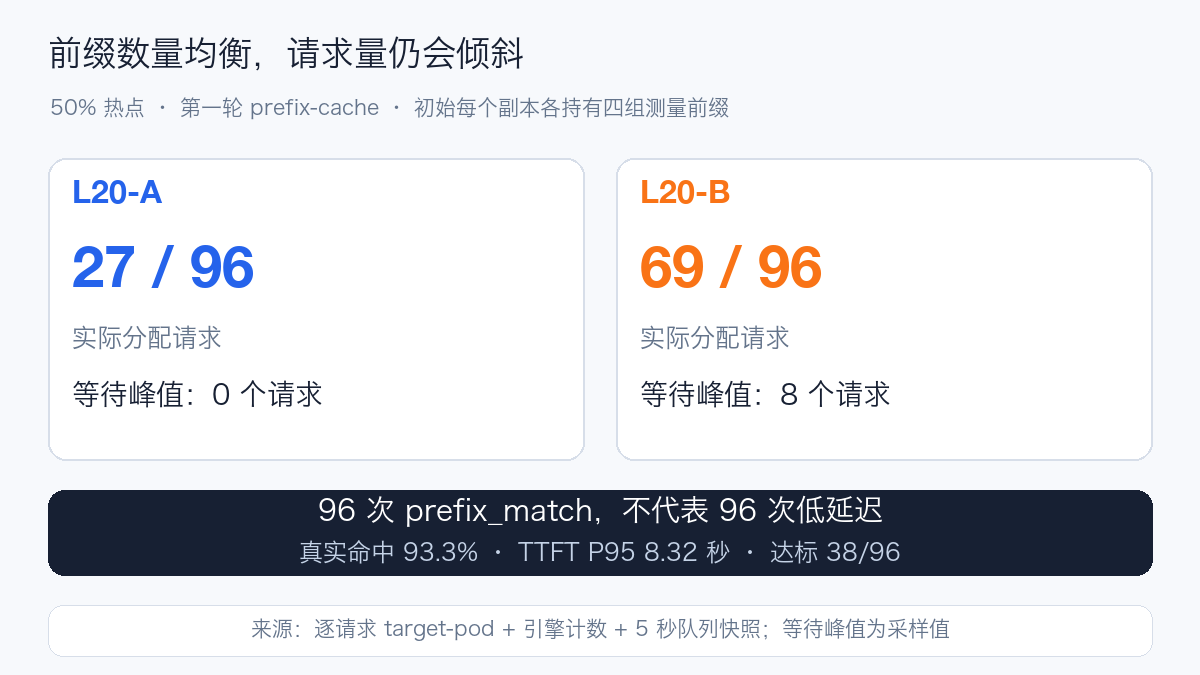
In the five-second snapshot, B's wait peak was 8 while A's was 0. Meanwhile, prefix-cache's TPOT P95 was 59.8 ms, lower than least-request's 71.6 ms; the main degradation appeared in the wait before the first content segment. This is not "the cache did nothing at all" — rather, cache locality and queue concentration occurred simultaneously.
Stronger hotspots are not necessarily proportionally worse
In round one's 89.6% hotspot, prefix-cache recorded 1 load-imbalance event, 1 least_request_fallback, and 95 prefix_match; the final request distribution was 38 / 58. Within the hotspot group itself, 34 requests went to A and 52 to B, with the first hotspot request entering A issued approximately 18.13 seconds after measurement began.
Cross-referencing the source code, this is consistent with the path where, after the load difference crosses a threshold, hotspot requests are sent to the other replica, after which both sides hold historical prefix records. However, the count snapshots only provide whole-phase deltas and do not directly associate the independent ID of that single protection event with a specific request, so 18.13 seconds cannot be treated as a precisely measured protection trigger time.
This phase had a TTFT P95 of 6.53 s with 68/96 meeting the SLO — better than round one's 50% hotspot prefix-cache, but still worse than the same scenario's least-request at 1.77 s and 96/96 meeting the SLO. The routing has conditional branches, so the hotspot ratio and tail latency need not follow a simple monotonic relationship.
In round two's 50% hotspot, prefix-cache / least-request TTFT P95 were 8.279 / 1.907 s respectively, with 37 / 94 requests meeting the SLO. The two rounds are kept separate to avoid pooled statistics masking the differences.
6. How Grafana Connects Cause and Effect
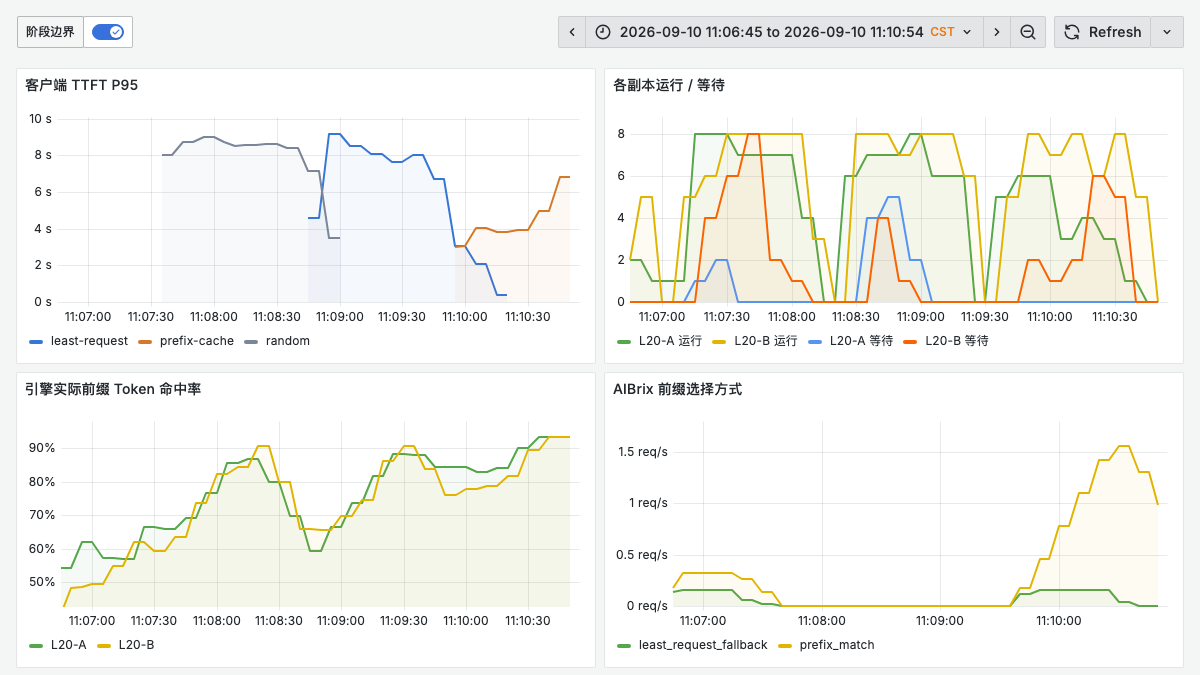
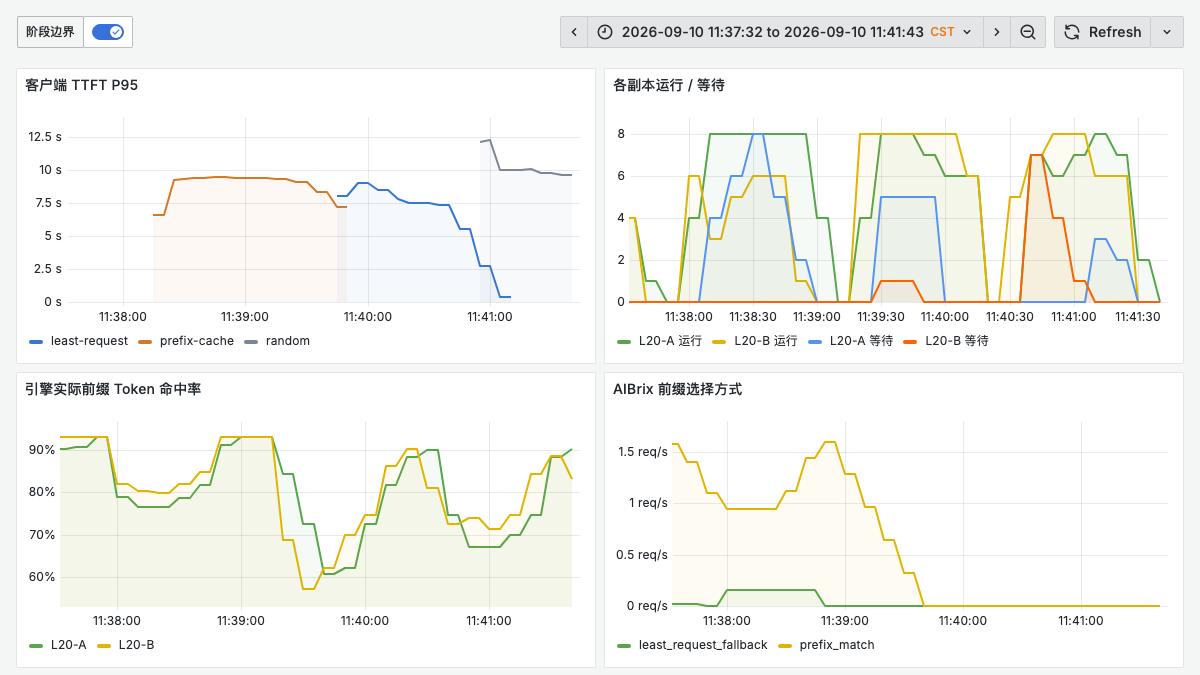
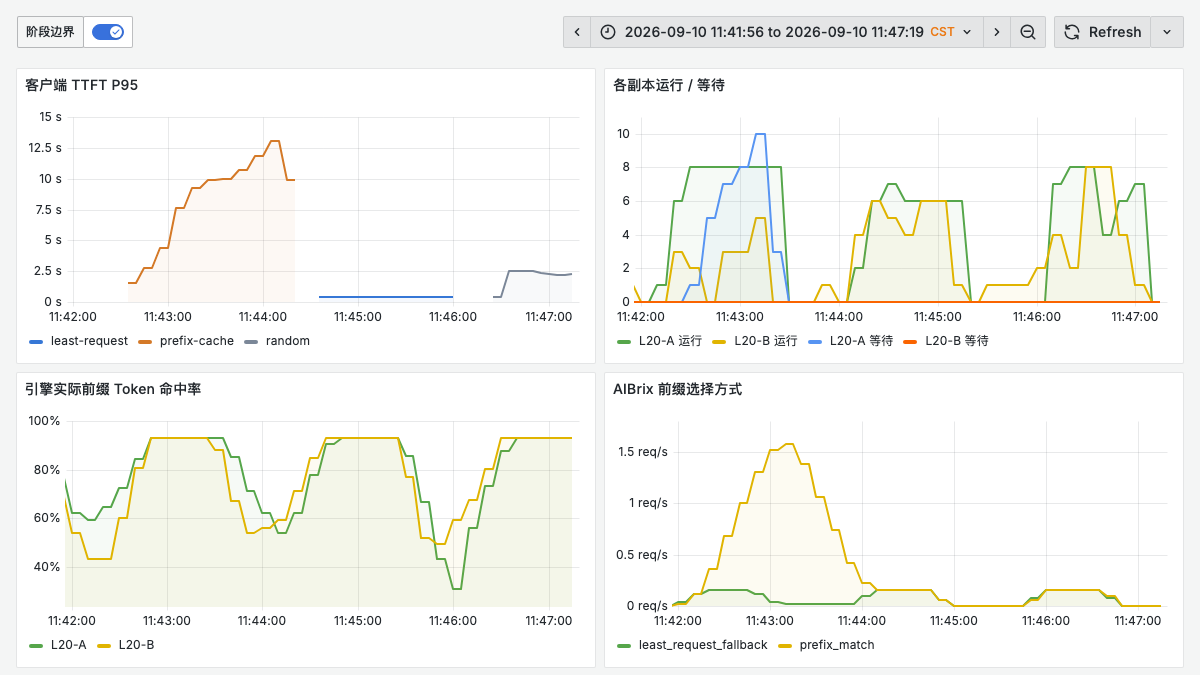
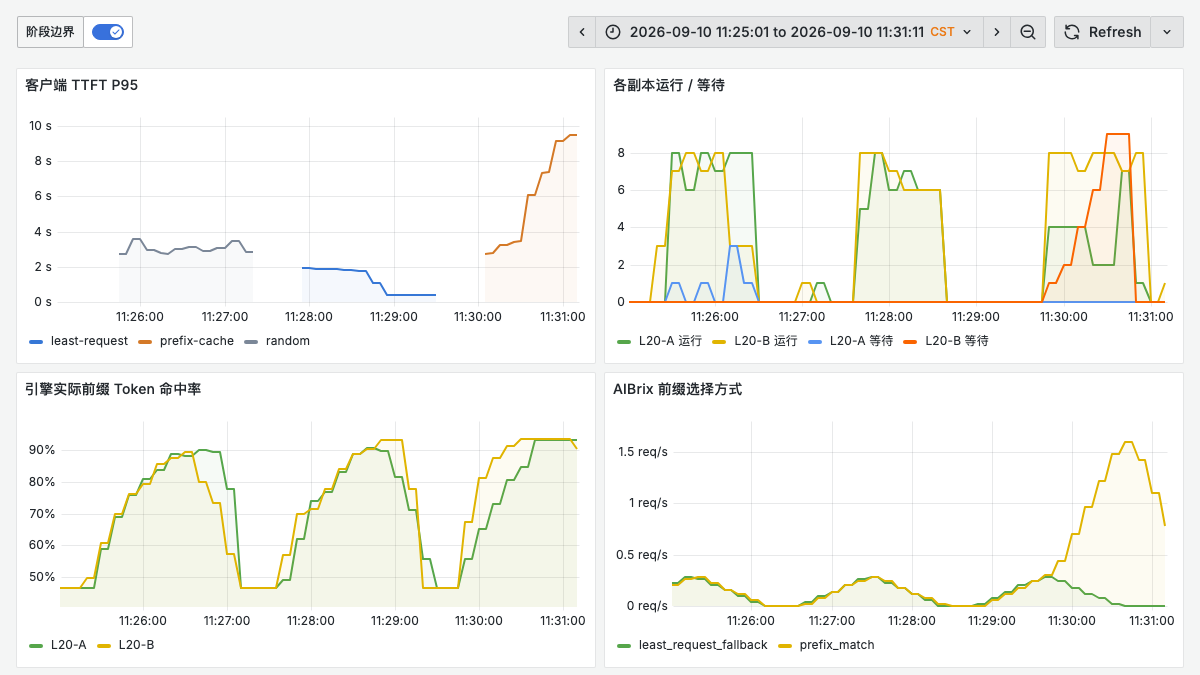
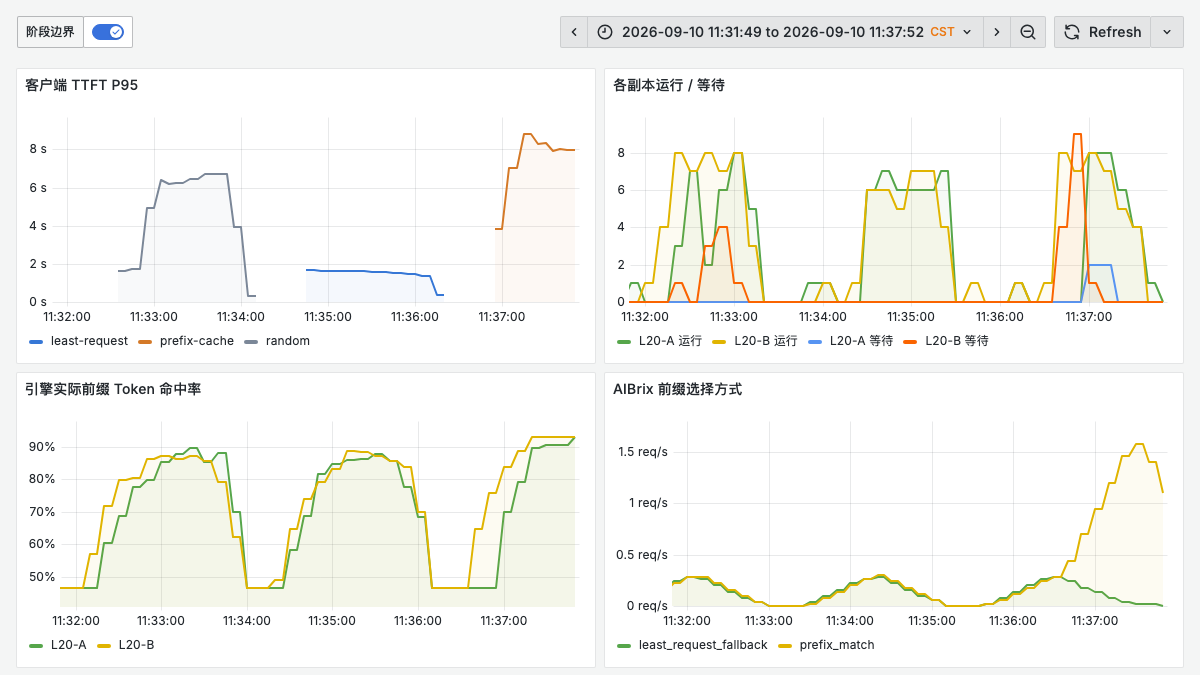
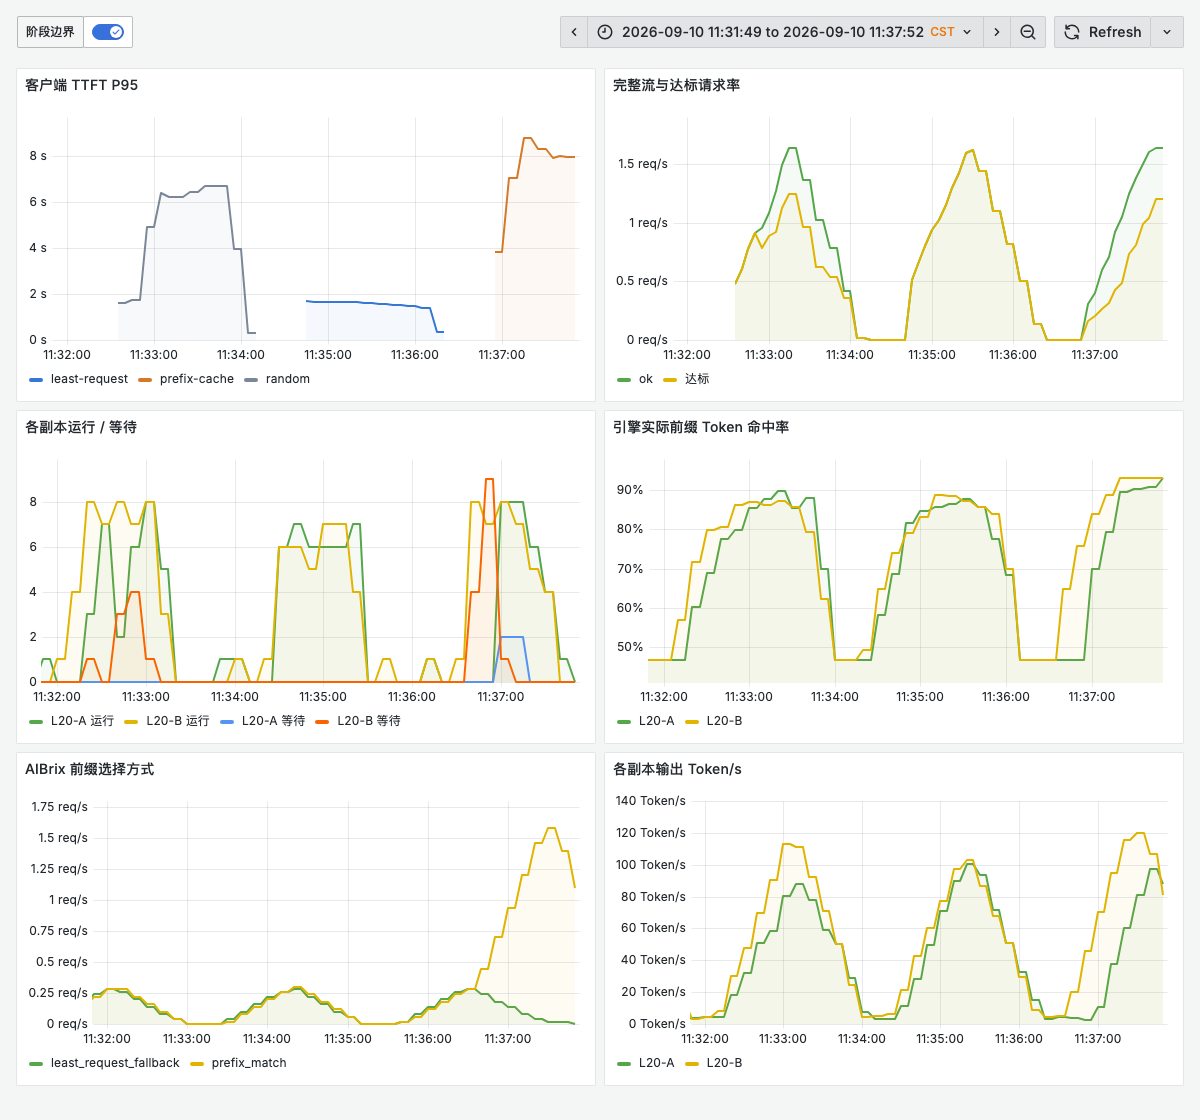
The above are real Grafana light-theme pages using a four-panel, 16:9 landscape layout: TTFT, per-replica in-flight and waiting requests, actual KV hits, and AIBrix routing choices. Full six-panel screenshots and dashboard JSON are retained in the evidence appendix at the end. Round one ran random, least-request, prefix-cache in sequence; round two ran in reverse order, and the strategy legends in the figures correspond to the time segments. Initialization traffic sits in the measurement gaps. The five-second client snapshots and Prometheus scrape instants differ, so observed instantaneous queue peaks may differ.
It is recommended to read the six items on the same timeline in order: routing choice → per-replica distribution → actual KV hits → wait queue → TTFT → SLO compliance. A rise in prefix-routing match-selection counts only explains the first step; if the wait queue rises in tandem, one must continue to check whether the client actually benefits.
# 本例网关按模型过滤:每秒前缀匹配与回退次数
sum by (selection) (
  rate(aibrix_prefix_cache_routing_selection_total{model="qwen38-aibrix-lab"}[1m])
)

# 真实缓存 Token 命中率,按副本别名区分
sum by (node_alias) (rate(vllm:prefix_cache_hits_total{model_name="qwen38-aibrix-lab"}[1m]))
/
sum by (node_alias) (rate(vllm:prefix_cache_queries_total{model_name="qwen38-aibrix-lab"}[1m]))

# 排队是 Gauge;不对它做 rate
sum by (node_alias) (vllm:num_requests_waiting{model_name="qwen38-aibrix-lab"})

# 客户端分布先合并桶,再计算分位数
histogram_quantile(0.95, sum by (le, phase) (
  rate(routing_study_ttft_seconds_bucket{job="qwen-routing-study"}[1m])
))
In production, cluster, namespace, model, and scrape-task filters should be added to avoid mixing different services into the same curve. node_alias is the scrape label for this experiment and must be established in your own relabel configuration. routing_study_* comes from this streaming client and is not a built-in AIBrix metric.
Whole-round tables for counter-type metrics use the difference between direct scrapes before and after measurement, excluding initialization requests. The one-minute rate() window in the screenshots may include the warm-up tail before the phase, so one cannot multiply a point on the graph by the duration to infer an exact request count. Allocation counts come from target-pod and were cross-checked phase by phase against each replica's request_success_total deltas.
7. What Should Drive Production Configuration
First determine whether there is a reusable stable prefix. Repeated system prompts, identical RAG documents, or multi-turn sessions may benefit, but placing user nonces or timestamps at the very front will break prefix reuse for subsequent long text. Input length, shared prefix length, and output length should all be recorded in load-test logs.
Choose the strategy by latency target, not by hit-rate ranking. Longer inputs with shorter outputs generally make repeated Prefill more worthwhile; with long outputs, strong hotspots, and visible single-replica queues, one must weigh the concentration caused by locality. Run a fixed-replica baseline first, then tune routing parameters, and only then layer in autoscaling — avoid attributing the effect of added hardware to the algorithm.
Load thresholds must match replica scale and capacity. The current 16 / 2 is merely the measured parameter for this environment. Observe gateway in-flight deltas, engine queueing, and SLOs before deciding whether to tighten; tightening may increase cross-replica cold Prefill, and one cannot assume it will only improve things. This round did not perform a threshold sweep on the shared gateway, so no "optimal threshold" is offered.
Be explicit about where cache state comes from. A new replica has no KV from the old replica, and the historical index is not the same as live KV. Whether to enable KV event sync, remote tokenizer, or gateway multi-replica state sync should be verified against a fixed version for engine and control-plane compatibility, then separately validated for eviction, restart, and scale-out behavior. This round did not validate these advanced capabilities, and their design documents cannot be used to claim the current system already has those effects.
Keep SLOs on both the server and client sides. Ingress HTTP 200, gateway phase success, and full stream completion are different events. During upgrades or rollouts, check stream interruption, missing [DONE], incorrect usage, rejections, and timeouts simultaneously; see L20 Capacity, Rollout, and Overload Protection in Practice for the comparison method.
To clear initial KV, this round temporarily enabled a development interface on the dedicated experiment replica and disabled it afterward. The cache-reset endpoint changes service state and should not be exposed as a production-facing API. vLLM development mode documentation
8. Fix Log and Applicability Boundaries
The first warm-state initialization used 1-token outputs and did not satisfy the warm-up script's content / full-stream checks, so the phase never entered formal measurement. The initial implementation also treated an empty-string exception as no error, causing the upper layer to attempt reading a nonexistent result file. This was changed to preserve repr(exception), determine failure by whether the error field exists, and save diagnostic fields for [DONE], content, and usage; warm-up was changed to 16 tokens. The failed initialization was archived separately and not counted in formal results.
After the failure, the dedicated GPU service auto-scaled down; after recovery, compute shapes were re-warmed and the remaining phases continued. The three round-one cold-cache phases occurred before the restart, and subsequent phases after; parameters and fixed nodes were unchanged, and round two ran in reverse order to observe variance — this cannot be claimed to eliminate all runtime environmental effects.
In round two's near-90% hotspot least-request initialization, the 16 candidates landed at 3 / 13, failing to reach the threshold of four groups per side, so formal measurement never started. That initialization was archived separately; the protection flow released the GPU; after re-confirming resources, the two replicas on the same node were restored, compute shapes were re-warmed, and the final two groups were completed. Initialization now adds up to three retries; subsequent attempts first clear KV and change the prefix salt, still using 16 candidates; qualification is judged only by initial assignment, not by filtering on formal measurement results. A service restart occurred between the last two groups and the preceding group, which is an additional environmental boundary for round two.
This experiment used synthetic English repeated documents, two replicas, a shared node, and two short measurement windows. It supports analysis of routing mechanisms and service trade-offs in this configuration, but does not constitute long-term stability, real RAG content quality, cross-model generalization, or full production acceptance. With only two replicas, the mathematical boundaries of load filtering cannot be directly extrapolated to a dozen or more replicas.
Engine phase counts and per-request attribution all cross-checked successfully. The three round-one cold-cache phases did not save gateway before/after count snapshots, so the corresponding fields are null; these phases still have per-request gateway logs and Prometheus historical data, and missing fields must not be treated as zero events.
Downloadable review materials:
- Complete two-round results JSON: per-phase latency, cache, allocation, queue snapshots, raw candidate mapping, and routing counts.
- Per-request records JSONL.gz: public replica aliases, timestamps, usage, full stream results, and SLO compliance determination.
- Offline recomputation script:
python3 recompute.py requests.jsonl.gz, reads data only and does not access the cluster. - Request reconstruction script:
python3 make_request.py --phase r1-hot50-prefix-cache --family 0 --index 17 > request.json, restores Prompts fromresults.jsonin the same directory; outputs JSON only and sends no requests. You must select the correct model name, routing header, and ingress yourself. - Prometheus historical export: query expressions, five-second query step, and raw finite samples; query step is not the same as scrape interval.
- Complete routing dashboard JSON, plus six-panel evidence views for cold cache, 50% hotspot, and 89.6% hotspot.
- Full six-panel screenshots: round one cold cache, round two cold cache, round two warm, 50% hotspot, 89.6% hotspot.
- Data provenance and SHA-256 manifest.
Formal statistics exclude compute-shape warm-up, the 24 pilot requests, prefix initialization, and failed initialization. After completion, the dedicated GPU Deployment was scaled down to 0 and the temporary development interface configuration was revoked.