可观测性与资源核算
创建于
更新于
预计阅读约 2 分钟
Kubernetes 容器指标无法覆盖 Kata/Firecracker 沙箱的完整成本。容量决策至少需要 对齐以下三层数据:
单点采样结果
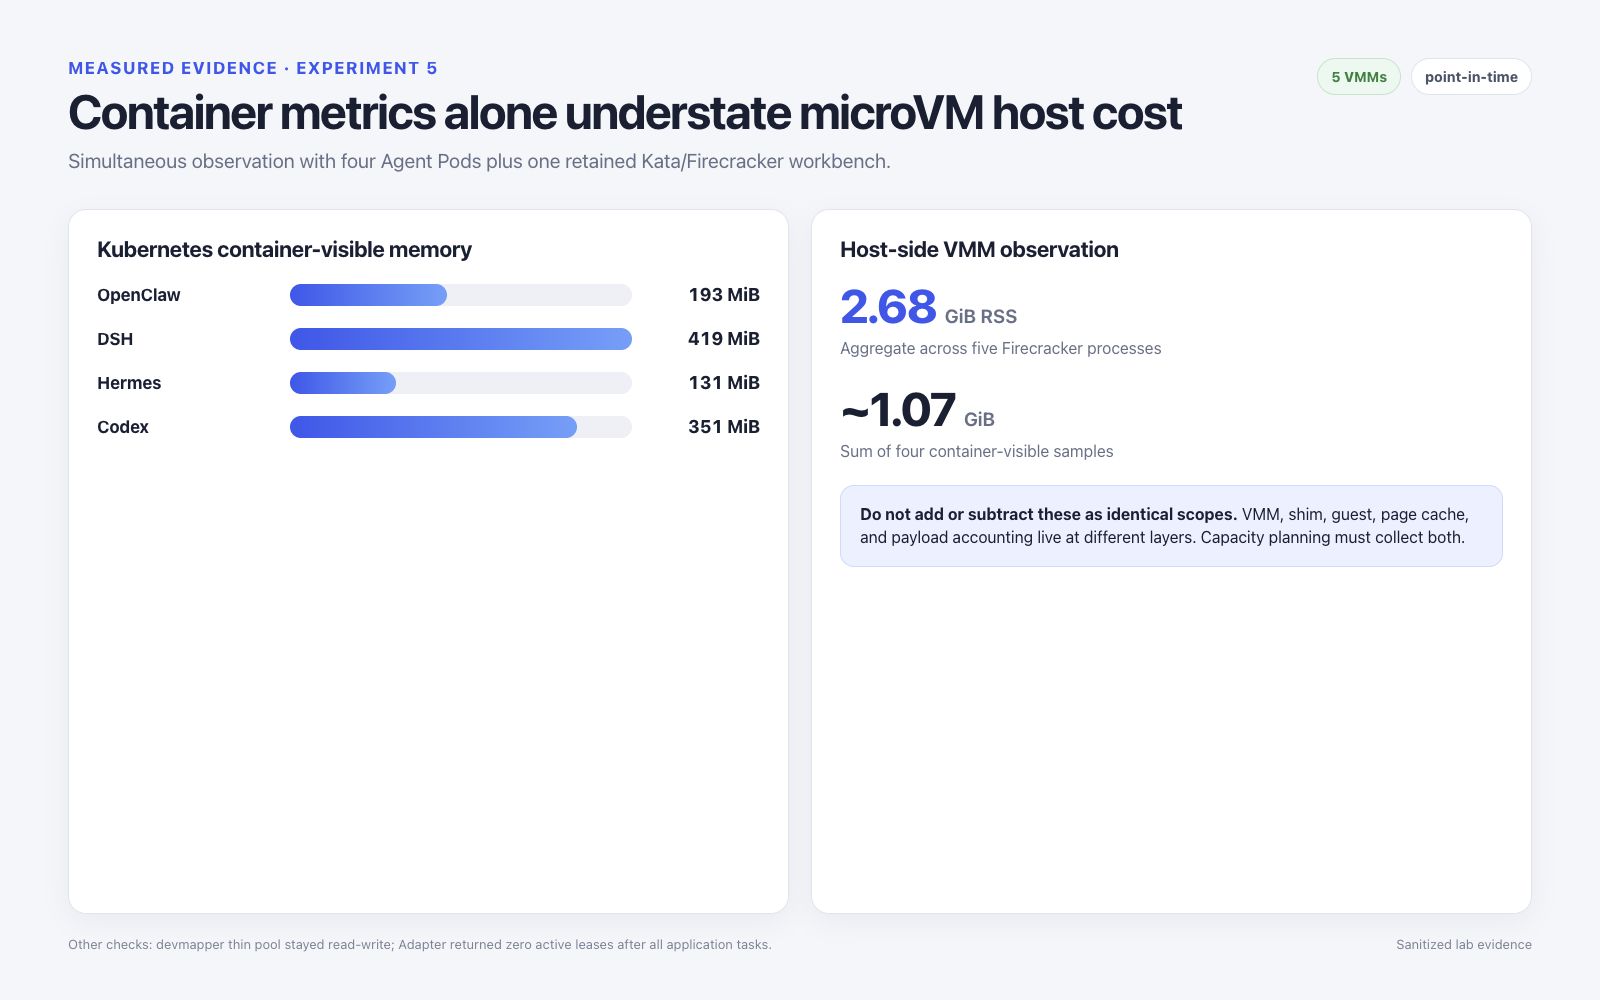
采样时共有四个 Agent Pod 和一个保留的 Workbench 正在运行。
| 信号 | 观测结果 |
|---|---|
kubectl top 中的业务容器内存 |
OpenClaw 193 MiB、DSH 419 MiB、Hermes 131 MiB、Codex 351 MiB |
| 业务容器小计 | 1,094 MiB,约 1.07 GiB |
| 宿主机 VMM 数量 | 5 个 Firecracker 进程 |
| VMM RSS 合计 | 2,812,964 KiB,约 2.68 GiB |
| 采样时宿主机内存 | 已用 12,128 MiB,可用 227,135 MiB |
| 宿主机平均负载 | 1.75 / 1.07 / 1.05 |
| Devmapper | Pool 可写,利用率较低 |
| Adapter 生命周期 | 任务结束后 cube_adapter_active_leases 为 0 |
这些只是某个时间点的冒烟观测,不是容量基准。关键发现是核算缺口:仅累加四个业务 容器的读数,会遗漏 Firecracker VMM 工作集和其他宿主机侧运行时成本。
采集清单
使用时间戳或运行 ID 关联以下数据源:
kubectl top pod -n agent-runtime
kubectl get pod -n agent-runtime -o wide

# 在专用 Worker 上执行:
ps -eo pid,ppid,rss,etimes,args | grep '[f]irecracker'
dmsetup status fc-devpool
ctr -n k8s.io snapshots --snapshotter devmapper ls
还应保留:
- Kata shim 的 CPU/RSS 及其 cgroup 路径;
- VMM 的 CPU/RSS 和线程数;
- CNI/TAP 计数器和丢包数;
- devmapper 数据与元数据利用率;
- Firecracker API、块设备、网络、延迟和 seccomp 指标;
- Adapter 请求延迟、错误数、活跃租约和释放结果。
Firecracker 指标需要在启动前配置,而且不会随快照状态自动恢复。恢复流程必须先重新 创建 metrics 和 logger 端点,再加载快照。