vLLM 0.32.0 Upgrade Test: DeepSeek-V4.1-Flash on Eight H20-3e GPUs¶
DeepSeek-V4.1-Flash is an open-weight multimodal model combining a mixture of experts with Engram conditional memory. The earlier eight-GPU deployment article used a pinned support build from the model's release period. This experiment keeps the original model weights and compares that build with vLLM 0.32.0 to answer an operational question: after reading reports of improvements, is the upgrade worthwhile for an existing H20-3e service?
The same-node, sequential follow-up completed 60 rounds and 1,968 formal requests. Output throughput increased approximately 123% for 8K input at concurrency 8, while single-request long-output performance was nearly unchanged. The old and new builds returned no usable text for 6/984 and 11/984 requests respectively. Gains were concentrated in longer inputs and higher concurrency; validating complete output remains part of upgrade acceptance.
1. Why run this upgrade experiment?¶
Recent WeChat and public discussions of newer vLLM performance motivated this experiment; technical claims were checked against primary sources. In its October 7, 2026 article, the vLLM team reported substantial AgentX improvements, including 1.9× at low concurrency and 5.3× throughput under a 150 TPS constraint. That article predates 0.32.0 and compares particular optimized configurations against the team's Day 0 implementation. Those multipliers do not automatically apply to every machine upgraded to 0.32.0. Official performance article
0.32.0 was released on October 18. Its release notes include preferring Humming on Hopper/SM90 and pinning humming-kernels==0.1.17. 0.32.0 Release
Rather than compare an arbitrary old build with an unspecified latest image, we restored the exact image used in the earlier article and compared it with a fixed 0.32.0 image. No rolling nightly or DeepSeek-V4.1-Flash-1017 weights were used.
2. What stayed fixed, and what changed with the upgrade?¶
| Condition | Configuration |
|---|---|
| Model | deepseek-ai/DeepSeek-V4.1-Flash, snapshot fb2764a5cf321eaa5070ca8f9e892818f477c16d |
| GPU | Single node, 8×H20-3e; 143,771 MiB reported per GPU; NV18 between every pair |
| Driver | 580.126.20 |
| Parallelism | Tensor Parallelism, TP8; Expert Parallelism, EP, enabled |
| CPU / RAM | Requests: 64 CPUs and 512 GiB; limits: 128 CPUs and 1,024 GiB; 64 GiB shared memory |
| Serving limits | Context 32,768; 32 running sequences; 8,192 batched tokens; GPU memory utilization 0.85 |
| Weights and caching | Same read-only shared storage; Engram on GPU; text prefix caching disabled; no DSpark speculative decoding configured |
| Client | Same pinned client image, tokenizer, strict streaming adapter and per-round seeds |
| Request endpoint | /v1/completions; fixed input/output lengths, temperature 0 and --ignore-eos |
| Software | Original article build | vLLM 0.32.0 |
|---|---|---|
| Actual vLLM version | 0.1.dev1+g79a7108d9 |
0.32.0 |
| Source commit | 79a7108d9aea27ddab99ce1779290d300b17fc23 |
5df63a7203cdb9328d824a27b682e77c7b9928be |
| Torch | 2.13.0+cu130 | 2.13.0+cu130 |
| Transformers | 5.17.0 | 5.19.0 |
| FlashInfer | 0.6.18 | 0.7.0.post1 |
| Installed Humming | 0.1.12 | 0.1.17 |
| Image digest | sha256:11d2c94063827768882b3a9ba2deca6c6e4fd9492753b651517c87f1fea916cb |
sha256:6ee133356d49ed24cee03dd0cda3d3980279a11c107ce3e752c89e76540f41c9 |
Identical commands do not guarantee identical execution paths¶
Both builds used the same explicit startup arguments below. /model represents the mounted model directory:
vllm serve /model \
  --served-model-name deepseek-v41-flash \
  --tensor-parallel-size 8 \
  --enable-expert-parallel \
  --max-model-len 32768 \
  --max-num-seqs 32 \
  --max-num-batched-tokens 8192 \
  --gpu-memory-utilization 0.85 \
  --tokenizer-mode deepseek_v41 \
  --reasoning-parser deepseek_v41 \
  --tool-call-parser deepseek_v41 \
  --enable-auto-tool-choice \
  --engram-config '{"cpu_offload":false}' \
  --no-enable-prefix-caching \
  --host 0.0.0.0 --port 30000
The actual logs reveal that SWA bounded replay, bounded replay for sliding-window attention, was enabled by default in the new build. The old source contained no swa_bounded_replay configuration option. The new log explicitly states that during eager prefill, layer 20 writes KV for every token, while the remaining relevant work and layers 21–39 process only the final 128 tokens of each request. Disabling prefix caching does not disable this decoder optimization.
The new build also logged the selection of HummingMxfp8LinearKernel and HummingGroupedExperts. These measurements therefore describe an upgrade of the image, dependencies and default execution strategy together. A measured percentage cannot be attributed entirely to Humming. Isolating bounded replay would require another controlled on/off experiment beyond these two groups. The official explanation also notes that bounded replay is not bit-exact recomputation, so application-quality regression testing remains necessary. Bounded replay implementation
3. Method and treatment of failures¶
The follow-up covers 10 combinations of input length, output length and concurrency, with three formal rounds per build. Each round sends 8, 16 or 64 requests at C1, C8 or C32 respectively. Warmup is recorded separately. Formal input fingerprints match between builds for every paired round.
Output throughput is successfully returned output tokens divided by that round's measurement duration. TTFT means Time to First Token; this client specifically measures waiting for the first nonempty text chunk. TPOT means Time per Output Token, and E2E means end-to-end latency. Tables compute P95 within each round and then take the median of three rounds, rather than pooling all requests into one percentile.
Acceptance requires HTTP 200, the stream terminator, nonempty text, valid usage and the requested output length. Failures remain in the original request denominator. We retain observed throughput for cases containing failures, but exclude those cases from the chart of failure-free upgrade gains.
Empty-text failures have no valid first-content latency, so latency percentiles cover valid responses only; failures and original request denominators are shown separately. Throughput retains the full measurement duration, without removing time spent on failed requests.
The first execution stopped some new-build cases early because the orchestrator incorrectly counted warmup failures toward the formal failure guard. The follow-up fixes that counter and completes three rounds independently for each case. Another workload had occupied the original node, so both builds were paired again on a different node with the same hardware specification. Rounds from different nodes are not pooled into one median. Stage deadlines, service loss, CUDA/NCCL/OOM detection and an independent watchdog on another node handle termination and cleanup. Orchestration success and request success are reported separately.
4. Throughput: substantial long-input gains, little change in single-request long output¶
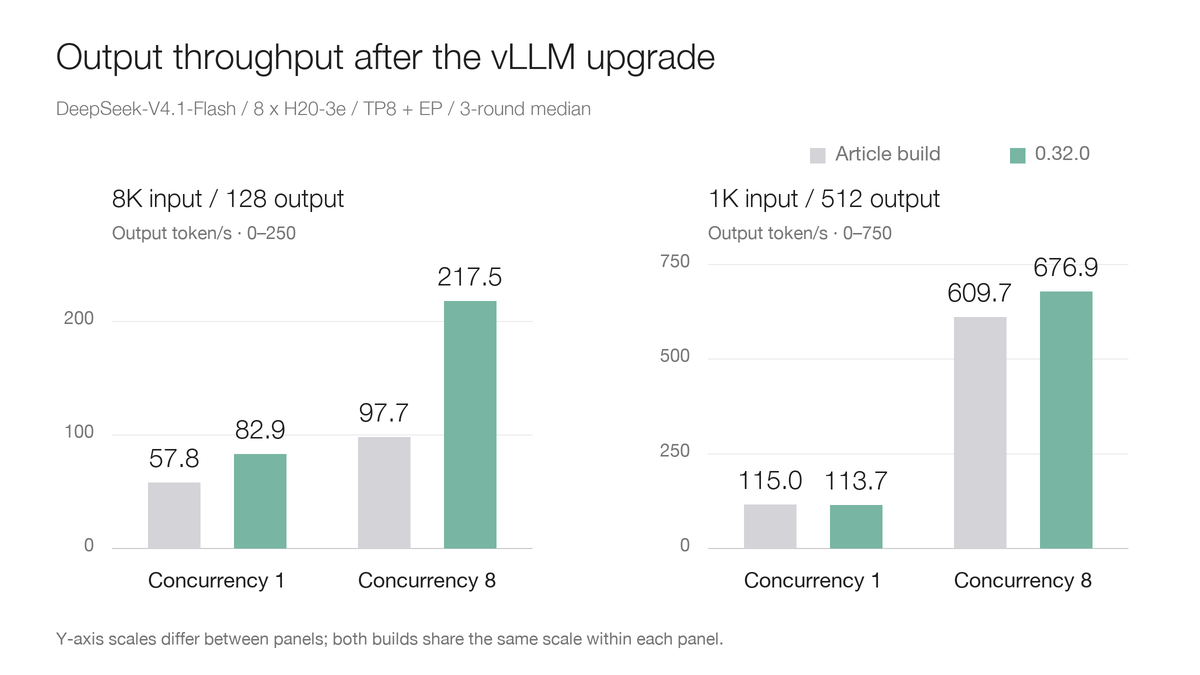
The left and right panels show long-input and long-output workloads on different y-axis scales; both builds share the same scale within each panel. Bar heights show three-round medians, with individual rounds retained in the public data file.
Units are output tokens/s. † indicates at least one invalid request across that build's three rounds. Such throughput is an observation with the original denominator retained; no upgrade percentage is assigned to those cases.
| Input→output / concurrency | Article build | 0.32.0 | Failure-free gain | Article valid requests | New valid requests |
|---|---|---|---|---|---|
| 1,024→128 / C32 | 615.73† | 1,015.77† | — | 191/192 | 190/192 |
| 8,192→128 / C1 | 57.76 | 82.94 | +43.6% | 24/24 | 24/24 |
| 8,192→128 / C8 | 97.69 | 217.46 | +122.6% | 48/48 | 48/48 |
| 8,192→128 / C32 | 106.52† | 263.14† | — | 190/192 | 190/192 |
| 1,024→512 / C1 | 115.00 | 113.69 | −1.1% | 24/24 | 24/24 |
| 1,024→512 / C8 | 609.73 | 676.93 | +11.0% | 48/48 | 48/48 |
| 1,024→512 / C32 | 1,222.29 | 1,576.39† | — | 192/192 | 190/192 |
| 24,576→128 / C1 | 27.74† | 52.25† | — | 23/24 | 23/24 |
| 24,576→128 / C8 | 35.10 | 87.57† | — | 48/48 | 47/48 |
| 24,576→128 / C32 | 35.78† | 94.78† | — | 190/192 | 189/192 |
At 8K/C8, the new throughput is 2.23 times the original, an increase of 122.6%, not an additional 2.23 times. In contrast, 1K→512/C1 changes from 115.00 to 113.69 tokens/s, approximately −1.1%. Three short repeats do not establish that small difference as a persistent regression.
Fixed-length request throughput reflects both prefill waiting and decode speed. Faster processing of long inputs can reduce time to first content and admit subsequent requests into decode sooner. It does not mean every next-token generation step accelerates by the same factor.
Latency also depends on request shape¶
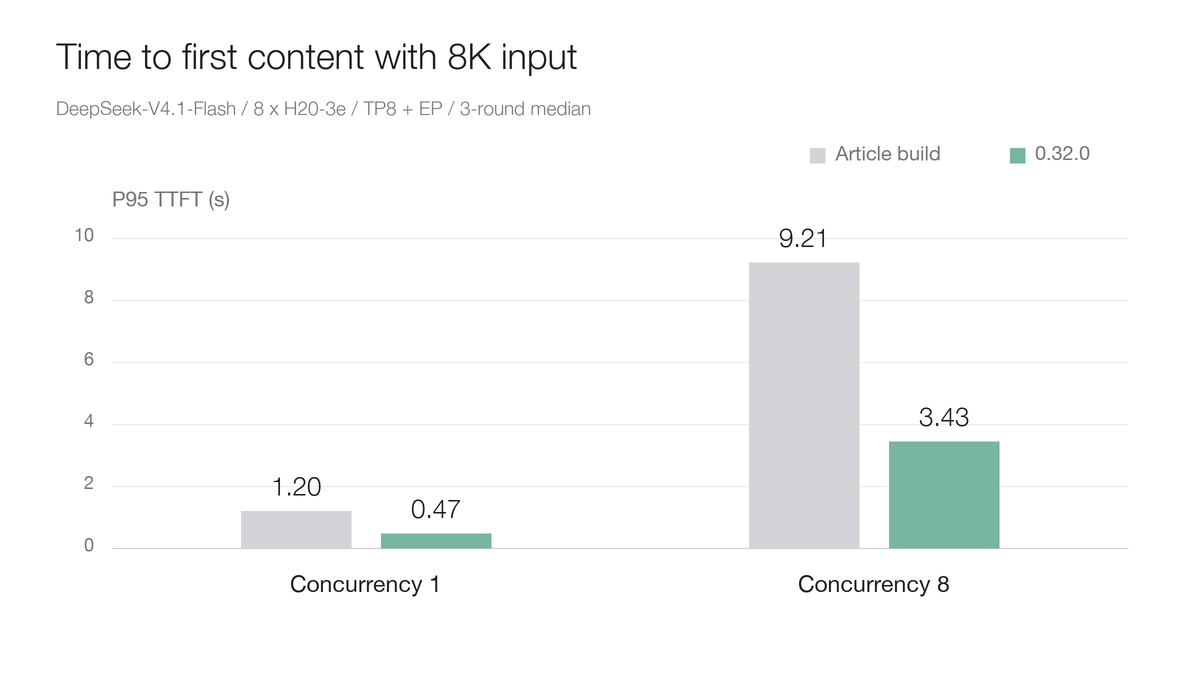
| Case | Article P95 TTFT seconds | New P95 TTFT seconds | Article P95 TPOT ms | New P95 TPOT ms |
|---|---|---|---|---|
| 8K→128 / C1 | 1.197 | 0.472 | 8.098 | 8.456 |
| 8K→128 / C8 | 9.206 | 3.429 | 72.662 | 32.852 |
| 1K→512 / C1 | 0.196 | 0.165 | 8.342 | 8.520 |
| 1K→512 / C8 | 1.177 | 0.564 | 12.606 | 11.430 |
P95 time to first content drops approximately 62.8% at 8K/C8. Single-request long-output TPOT does not improve in parallel, demonstrating why long-input serving and low-concurrency sustained generation need separate evaluation.
Completed paired results from the first batch¶
The following three cases come from the preceding same-node A/B batch, with three complete formal rounds each. That batch used a different physical node, so its results remain separate from the follow-up statistics.
| Input→output / concurrency | Article output tokens/s | New output tokens/s | Gain | Valid requests per build |
|---|---|---|---|---|
| 1,024→128 / C1 | 102.53 | 103.80 | +1.2% | 24/24 |
| 1,024→128 / C8 | 400.88 | 535.18 | +33.5% | 48/48 |
| 4,096→128 / C32 | 203.22 | 463.20 | +127.9% | 384/384 |
4K/C32 sends 128 requests per round. Its median per-round P95 TTFT is 15.271→5.826 seconds, and P95 TPOT is 142.979→63.282 ms. This supports the observation of gains at medium input length and high concurrency; it is not a ranking across nodes.
5. Why were there still failures?¶
| Formal follow-up statistics | Article build | 0.32.0 |
|---|---|---|
| Executed rounds | 30/30 | 30/30 |
| Rounds with every request valid | 25 | 21 |
| Rounds containing invalid requests | 5 | 9 |
| Valid requests | 978/984 | 973/984 |
| Invalid requests | 6/984, 0.61% | 11/984, 1.12% |
All 17 invalid requests returned HTTP 200, [DONE] and positive completion_tokens, but every choices[].text remained empty. The following extracts the relevant fields from one failed stream, omitting IDs and timestamps:
HTTP 200
data: {"choices":[{"text":""}]}
...
data: {"usage":{"prompt_tokens":1024,"completion_tokens":128,"total_tokens":1152}}
data: [DONE]
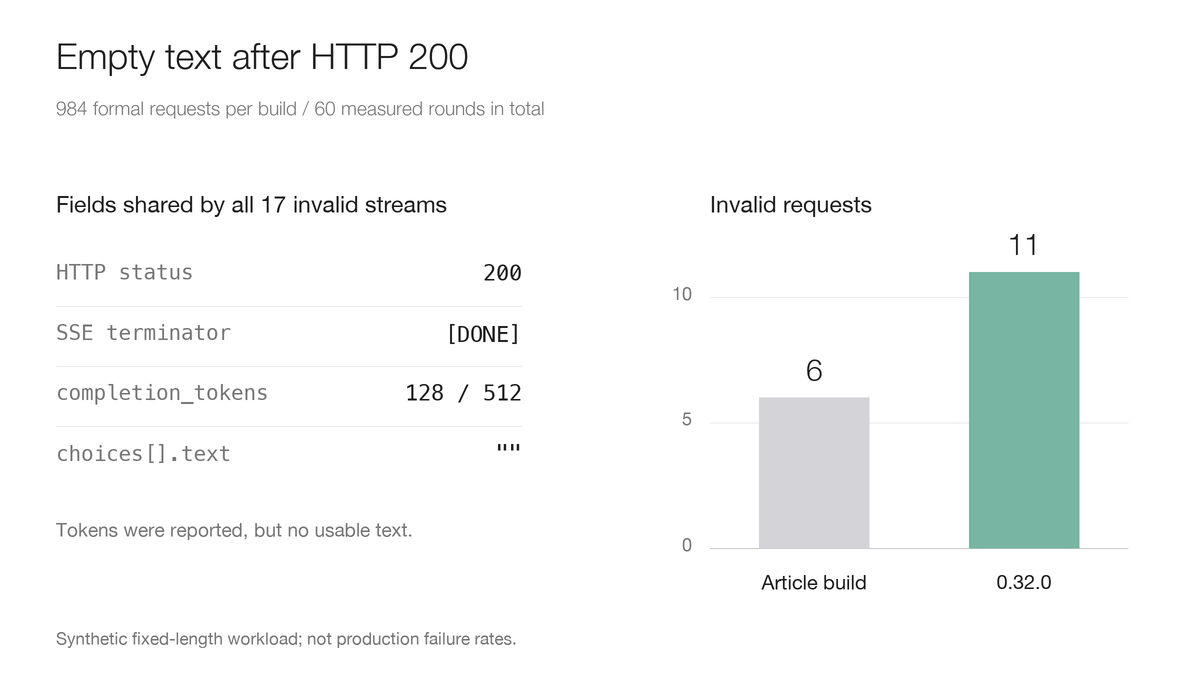
A zero exit code from the vllm bench subprocess or a healthy service endpoint therefore does not establish successful application output for that round. The strict client rejects these requests rather than treating the 128 or 512 tokens reported by usage as usable text delivered to the user.
Both builds exhibit the behavior. Evidence currently narrows it to the path involving synthetic fixed-length prompts, special tokens, decoding and streaming output; the root cause is not isolated. It does not establish GPU crashes, a Humming defect or a regression attributable to one version. The observed 0.61% and 1.12% are proportions for this synthetic workload, not production failure rates or a claim of statistical significance.
Further diagnosis should fix the failing input, retain token IDs, compare nonstreaming with streaming and pre/post-detokenization output, and introduce a natural-language prompt control. Relevant optimizations can then be toggled individually. Changing the model, prompt and sampling together and obtaining one success would not resolve the original failure.
The first batch's three rounds at an open-loop arrival rate of 0.300 req/s also contained failures and triggered the guard. The 0.480 and 0.660 levels remain unexecuted, so no SLO capacity limit is inferred. SLO means Service Level Objective. This experiment primarily compares versions; it does not establish a production capacity commitment.
6. What the actual monitoring showed¶
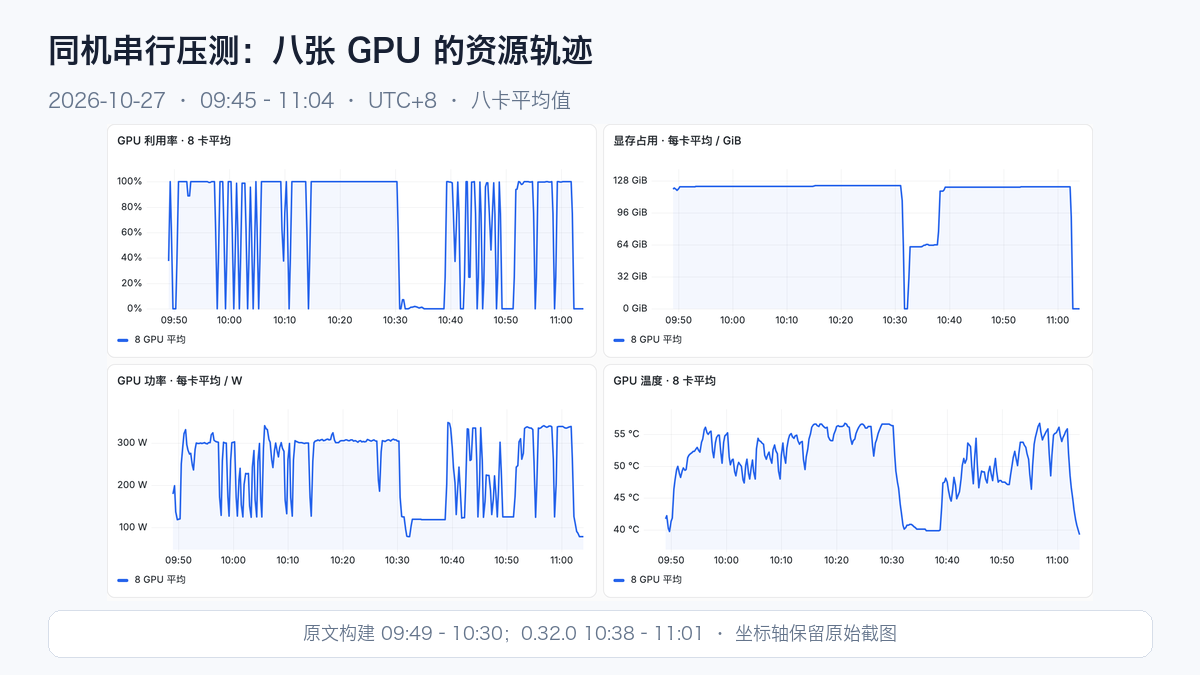
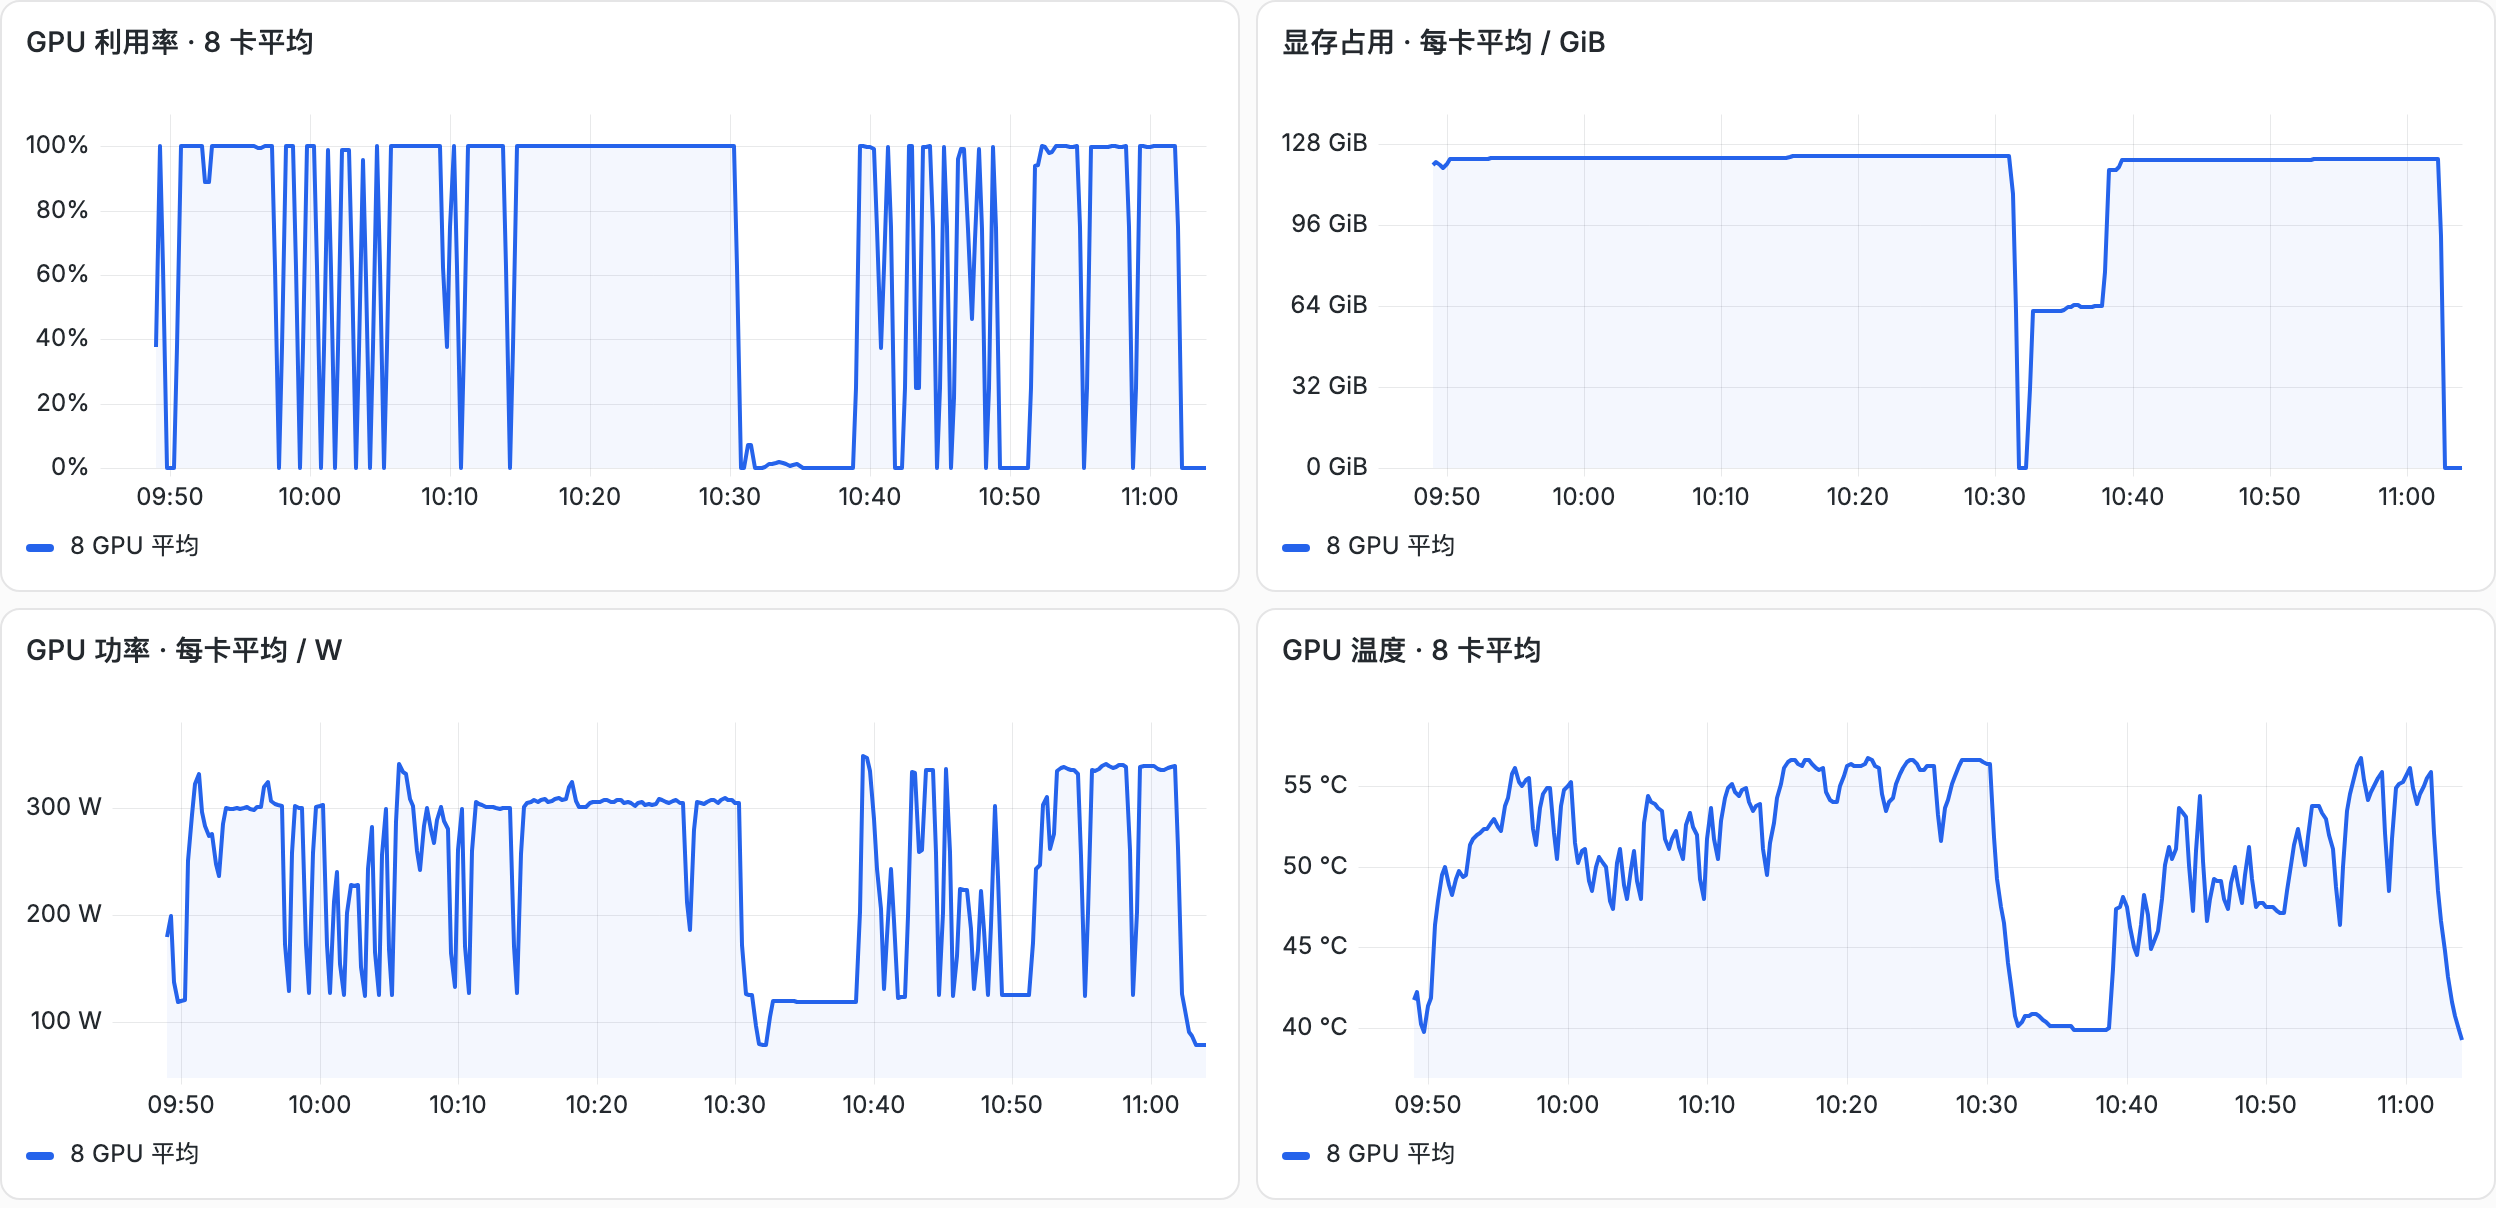
The screenshot covers October 27, 2026, 09:45–11:04, UTC+8. Formal cases ran approximately 09:49–10:30 for the article build and 10:38–11:01 for the new build. The intervening drop and rise in GPU memory reflects version switching, loading and initialization, rather than memory fluctuation during uninterrupted serving. Resource panels average all eight GPUs. A shorter test interval also does not by itself establish a precise energy saving.
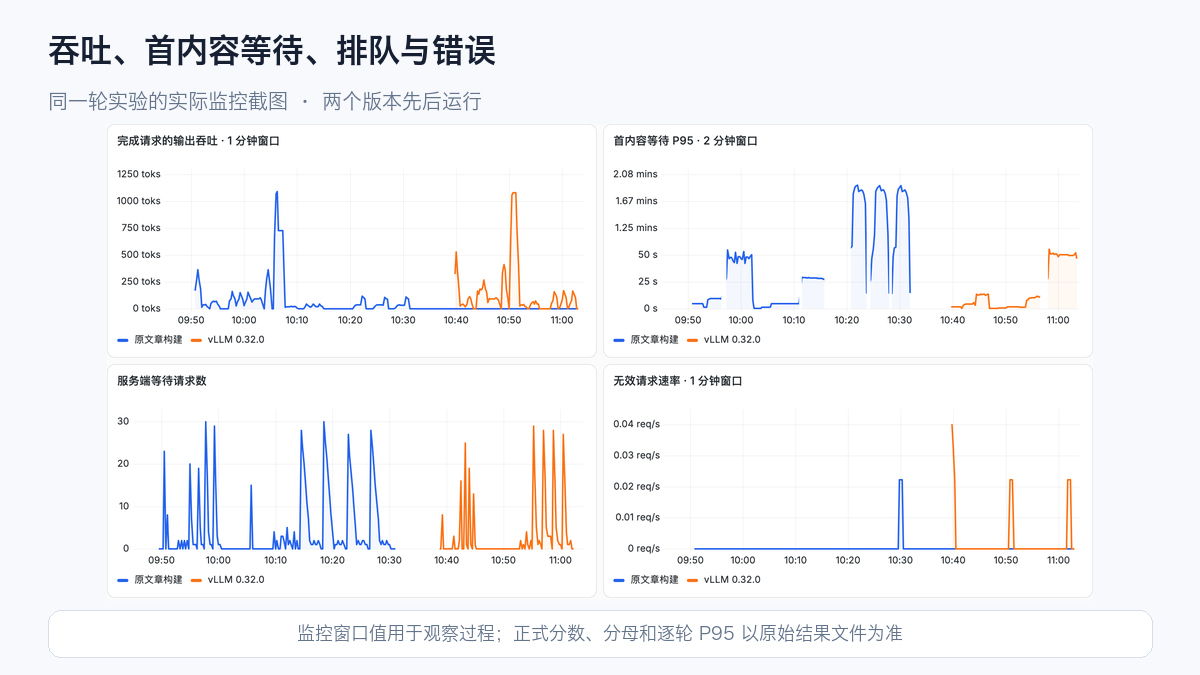
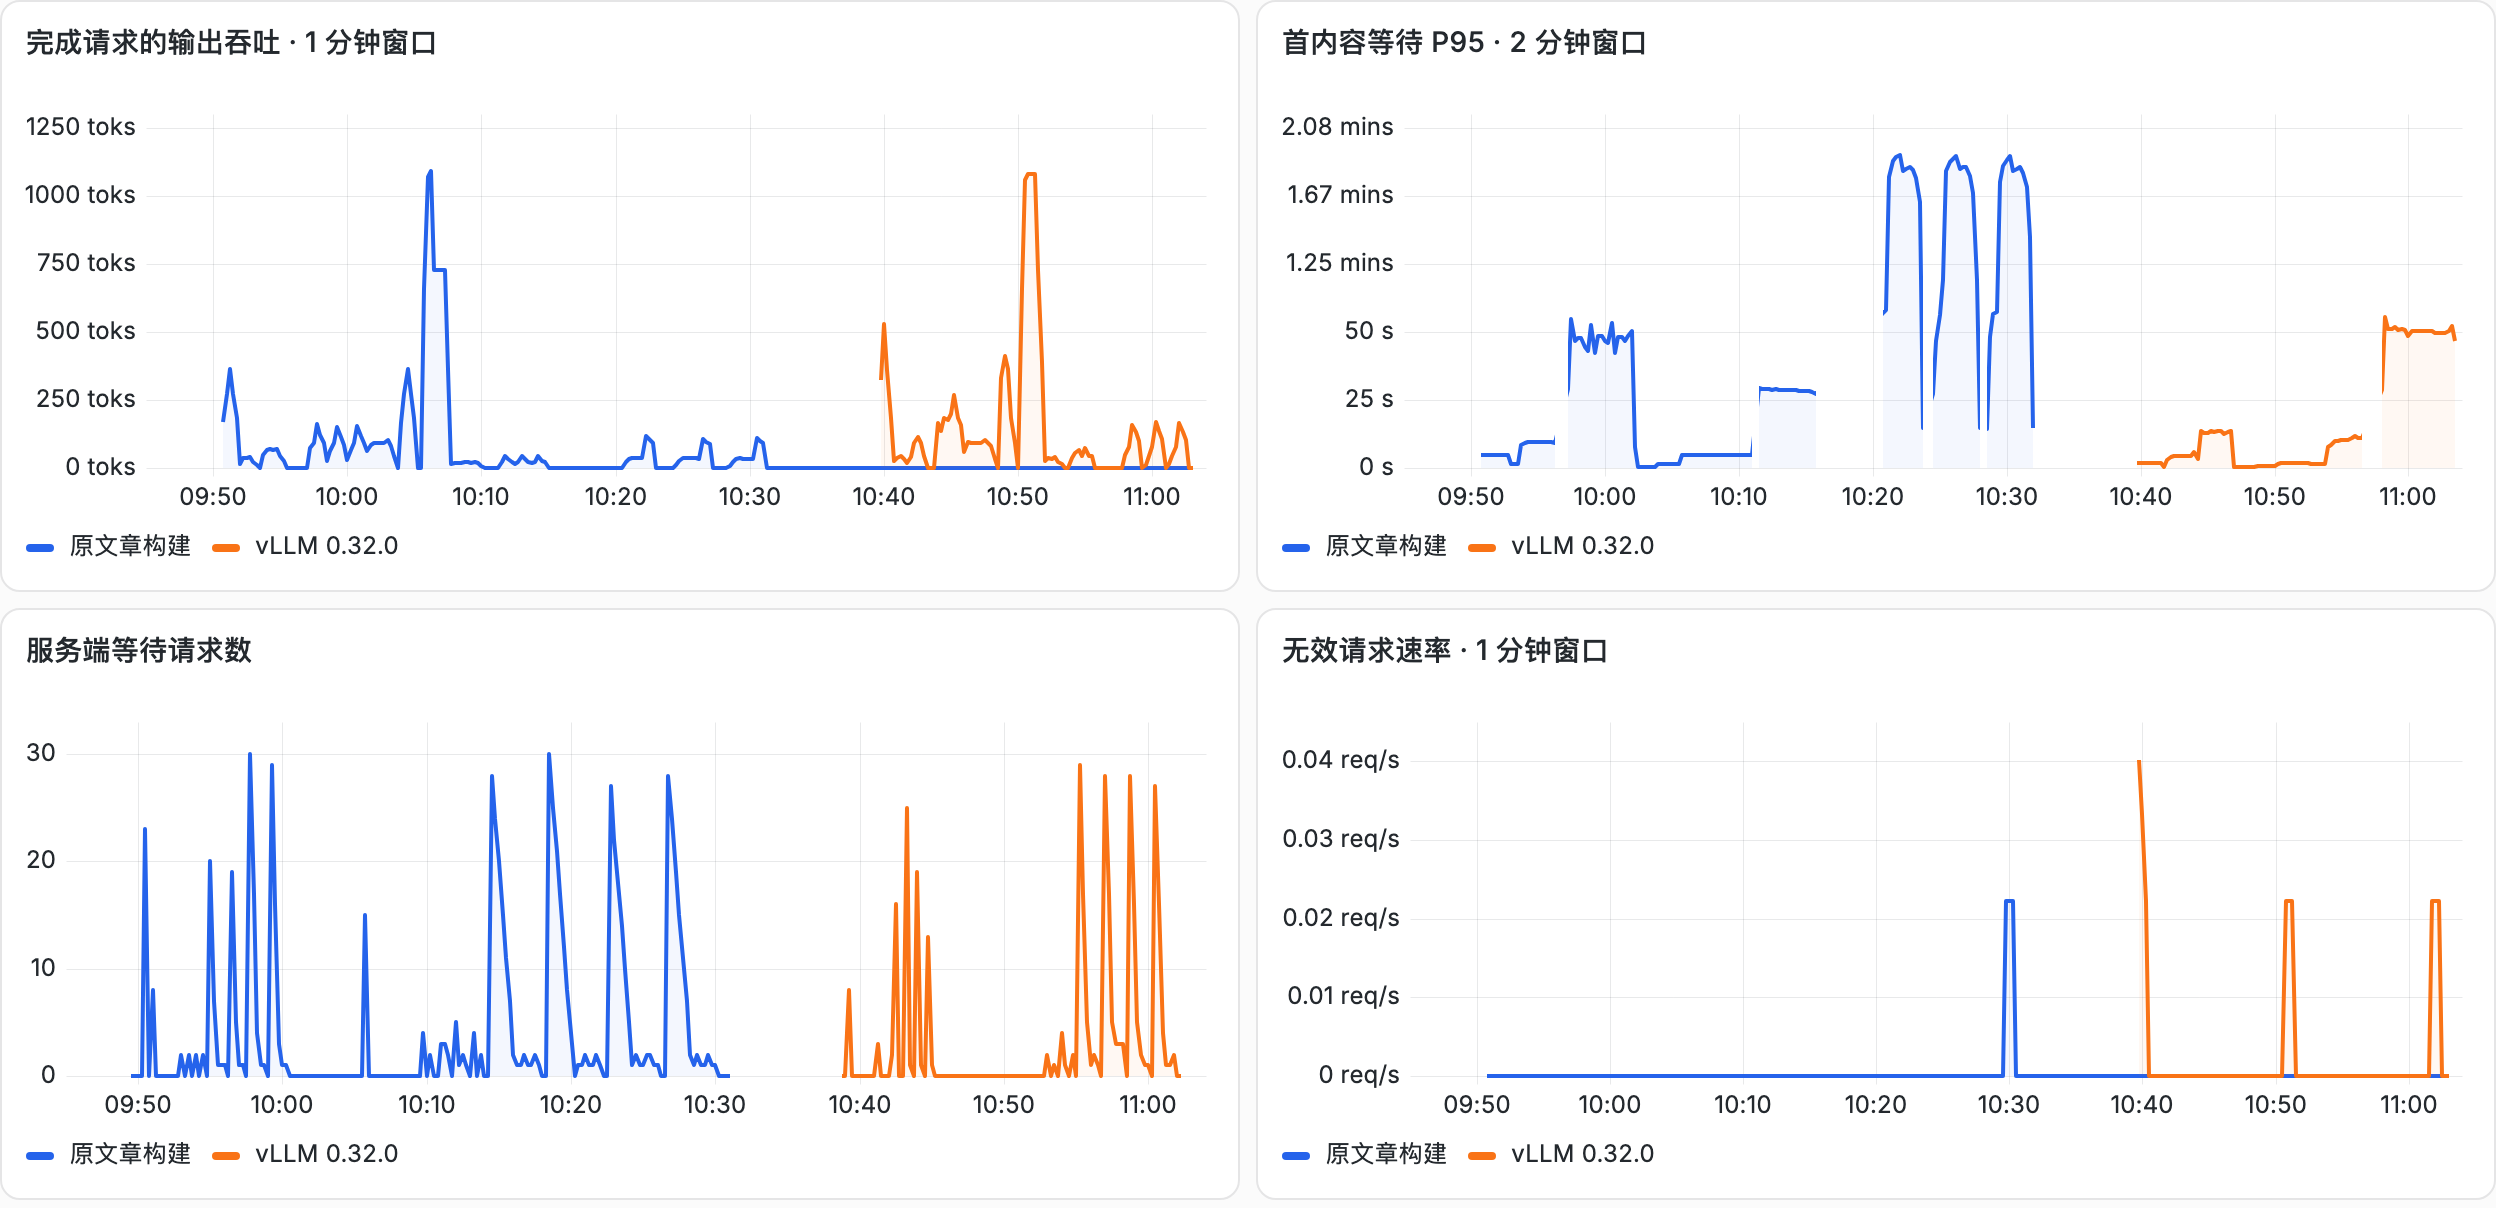
Blue represents the article build and orange represents 0.32.0; they ran sequentially. Case order is the same, but case durations differ, so equal wall-clock coordinates are not paired comparison points. Windowed throughput is influenced by requests completing together. Monitoring P95 comes from histogram windows and differs from the tables' exact per-round P95. Error rates are also affected by scrape timing and counter lifetimes; request files determine formal failure counts.
These are real historical captures from the dedicated experiment Grafana. Only layout and legends were arranged for presentation; metric values were not modified. Cluster names, IPs, internal domains and authentication information are not published. Chinese text inside genuine captures remains unchanged.
Original-resolution captures: four GPU panels and four request panels.
7. Functional checks and unattended execution lessons¶
Both builds passed the basic text and complete-stream gate, tool-call parsing, single-image vegetable recognition and two-image ordering checks in the follow-up. Vision used the original 2,048-token budget; the new build did not trigger the optional 4,096-token diagnostic. In the first batch, one two-image ordering question exhausted the new build's reasoning budget. The follow-up pass shows these examples are executable, rather than constituting a multimodal accuracy benchmark.
Unattended execution depends on distinguishing failure levels. Warmup failures neither increment nor reset formal consecutive-failure counters. A failing input-length/concurrency case does not block independent healthy cases; service loss or GPU runtime faults terminate the runtime group. Formal failures retain their denominators, code hashes and raw streams, while diagnostics use separate attempts. Stage deadlines and independent supervision clean up resources, but experimental results still require item-by-item review.
The experiment does not cover 1M context, CPU Engram, DSpark, long-duration stability or quality benchmarks. Short local measurements are not converted into production capacity per GPU. Test plans and environment configuration remain private. The public sanitized per-round results include denominators, failures, throughput, latency and source hashes for all 60 rounds.
8. Deciding whether to upgrade¶
For services with 8K-plus input, retrieval-augmented generation or long agent histories, 0.32.0 merits a canary rollout. Prioritize real time to first content, queues, usable-output ratios and representative task quality. Long-input gains are substantial, while the bounded replay default must be recorded as a quality-regression condition.
For one user, short input and sustained long generation, do not expect decode speed to double. The 1K→512/C1 case was nearly unchanged. If lower per-token latency is the objective, test that operating mode specifically.
For high-concurrency services, diagnose empty output and establish acceptance before increasing pressure. Pin image digests, model snapshots and dependencies, retain the old image and rollback procedure, and rebuild capacity conclusions using real prompts, error budgets and latency targets.
The practical conclusion is that 0.32.0 delivers clear long-input gains on this eight-H20-3e configuration, with benefits depending on request shape. Complete-stream validation also exposes an issue that still needs investigation before rollout.