RBG with Live Traffic: When Replicas Recover, Do Requests Recover?
Qwen3.8-27B is a 27-billion-parameter dense vision-language model that uses a hybrid architecture combining Gated DeltaNet and Gated Attention. Official FP8 weights are available, allowing single-GPU replicas to observe real model loading, compilation, and streaming generation. This experiment uses Qwen3.8-27B-FP8, one L20 per replica, text-only, 32K context, MTP disabled; it does not evaluate image understanding, long-context limits, or answer quality. Official model documentation
The previous AIBrix experiment examined whether the compute saved by prefix locality could offset queueing after request concentration. This article uses the same model, vLLM image, and AIBrix entry point, with routing fixed to least-request, and observes a different aspect: when replicas scale, update, or fail, what happens to in-flight requests.
RBG (RoleBasedGroup) uses roles to describe a set of workloads and their relationships, and is responsible for replica and lifecycle orchestration. The AIBrix entry point remains responsible for delivering requests to available model replicas. The two can be combined, but this experiment does not treat RBG as another routing algorithm, nor does it test RBG Planner's automatic decisions. RBG project, RBG Planner
Think of it as a restaurant: the front desk decides which chef receives a new order, while the manager handles staffing and shift changes. When the manager announces "add one chef," it does not mean the new chef can serve dishes immediately; during a shift change, orders already accepted cannot disappear just because someone leaves. The three questions here correspond to scaling decisions, model startup, and the draining and interruption of in-flight requests.
1. Four Moments That Cannot Be Collapsed into a Single "Recovery Time"
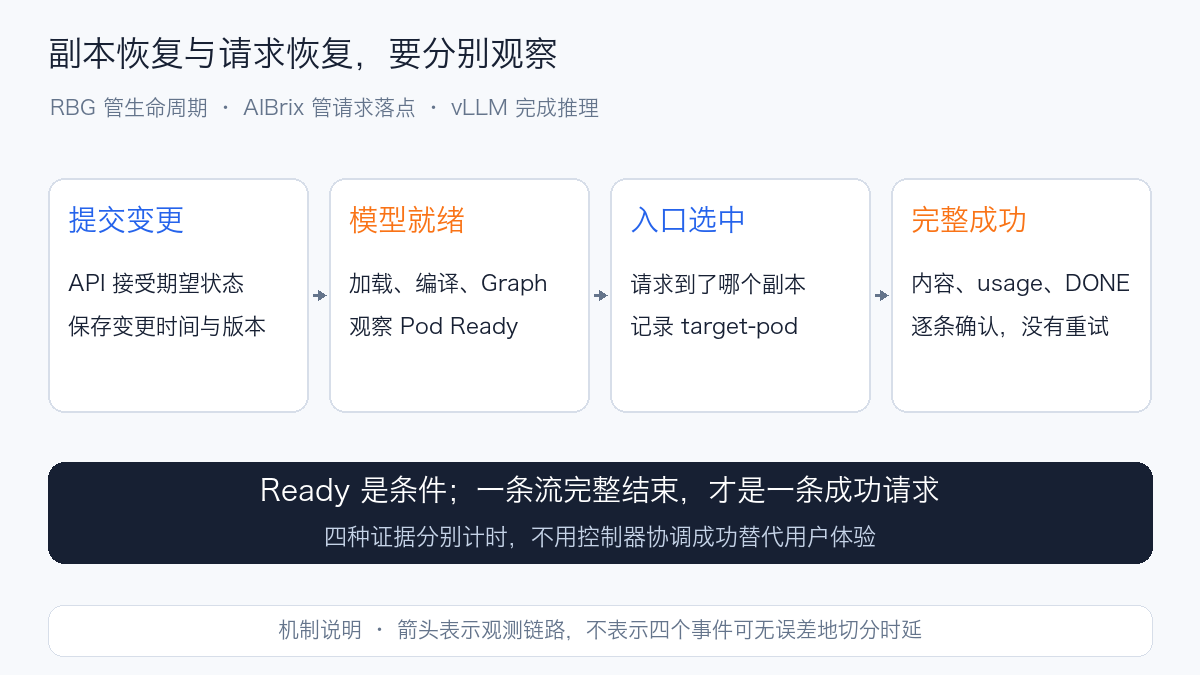
| Moment | Evidence in this experiment | What it can prove |
|---|---|---|
| API accepts the change | Control operation start/return timestamps and object version | Desired state has been submitted |
| Pod Ready | Pod UID, conditions, container status, and 5-second object snapshots | Kubernetes readiness condition has been satisfied |
| Entry point selects the new replica | Per-request target-pod response header |
Requests were indeed routed to this replica |
| New replica completes a full stream | First content, final content, usage, [DONE] |
At least one actual request completed successfully on this replica |
These observations come from different paths and should not be forcibly assembled into four segments with a strict ordering. Object polling has roughly 5-second granularity; response headers are recorded when the client receives the response, and stream completion occurs later than request arrival. The article should give the definition and observation precision of each event separately; when no independent record of the entry point's discovery event exists, do not use "first selection" to back-calculate a precise discovery time.
A successful controller reconcile only proves that one reconciliation cycle completed. The model may still be reading weights, compiling, or initializing CUDA Graphs. Conversely, two replicas remaining Ready does not prove that every existing stream remained uninterrupted.
2. What Was Actually Running
| Condition | Configuration in this experiment |
|---|---|
| RBG | v0.8.0 release chart; controller image tag v0.8.0-16705159, pinned by digest |
| Workload | RoleBasedGroup → RoleInstanceSet → RoleInstance → Pod; native standalone pattern |
| Replica mode | Stateful, preserving ordinal numbers; role is only server |
| Scaling entry | RoleBasedGroupScalingAdapter's /scale, manual step changes |
| Update method | RecreatePod, maxUnavailable=0, maxSurge=1, minReadySeconds=10 |
| Model | Qwen3.8-27B-FP8, 66 weight shards; records configuration, index SHA256, and shard sizes |
| GPU | Normally two single-L20 replicas, up to three; three fixed candidate nodes, shared with other workloads |
| Engine | Same image digest as the previous article; in-container vLLM 0.26.0b2.dev1+g3b102b576.cu129, Torch 2.11.0+cu129, TP=1, FP8 weights and FP8 KV |
| Capacity | max-model-len=32768, max-num-seqs=8, max-num-batched-tokens=8192 |
| Cache and startup | Prefix Cache disabled, Chunked Prefill enabled; compilation cache is Pod-level emptyDir |
| Entry point | Existing AIBrix v0.7.0 Gateway; least-request throughout |
| Exit | preStop waits 10 seconds, vLLM shutdown timeout 90 seconds, Pod grace period 180 seconds |
| Scheduling | Standard scheduler, node constraints and required replica anti-affinity; Gang scheduling not verified |
The controller uses two replicas spread across different nodes. This installation disables the control branches for legacy Deployment, StatefulSet, and LWS workloads, using the native RoleInstanceSet. The source commit of the released chart and the identifier in the image tag are recorded separately and are not conflated as the same build commit.
There is one deliberate change from the previous article: Prefix Cache is disabled. The previous article studied cache routing; this article reduces the interference of cache heat on replica lifecycle. Therefore, the previous article's 1.6 RPS cannot be directly treated as a safe load here, nor can the two experiments' TTFT values be used to rank RBG or AIBrix horizontally.
This experiment does not pin GPU device numbers on each node; actual devices are assigned by the scheduler and device plugin, and are traced back via DCGM's model Pod labels. Monitoring only filters the GPUs corresponding to this experiment's model Pods; GPU utilization from other workloads on the same node must not be included in the results.
3. Why Statefulness Changes Rolling Update Timing
The core role configuration is as follows; model startup parameters, storage, and permissions must be completed for your own environment:
apiVersion: workloads.x-k8s.io/v1alpha2
kind: RoleBasedGroup
metadata:
  name: inference-study
spec:
  roles:
    - name: server
      replicas: 2
      minReadySeconds: 10
      rolloutStrategy:
        type: RollingUpdate
        rollingUpdate:
          type: RecreatePod
          maxUnavailable: 0
          maxSurge: 1
      standalonePattern:
        template:
          spec:
            terminationGracePeriodSeconds: 180
            containers:
              - name: model
                image: <经过验证的推理镜像及 digest>
                resources:
                  limits:
                    nvidia.com/gpu: "1"
This is a configuration fragment, not a directly deployable complete manifest. Templates, probes, model mounts, and update strategies must be validated together. When an existing ScalingAdapter manages replicas, modify /scale through it afterward to avoid another configuration sync process repeatedly overwriting the role's replica count.
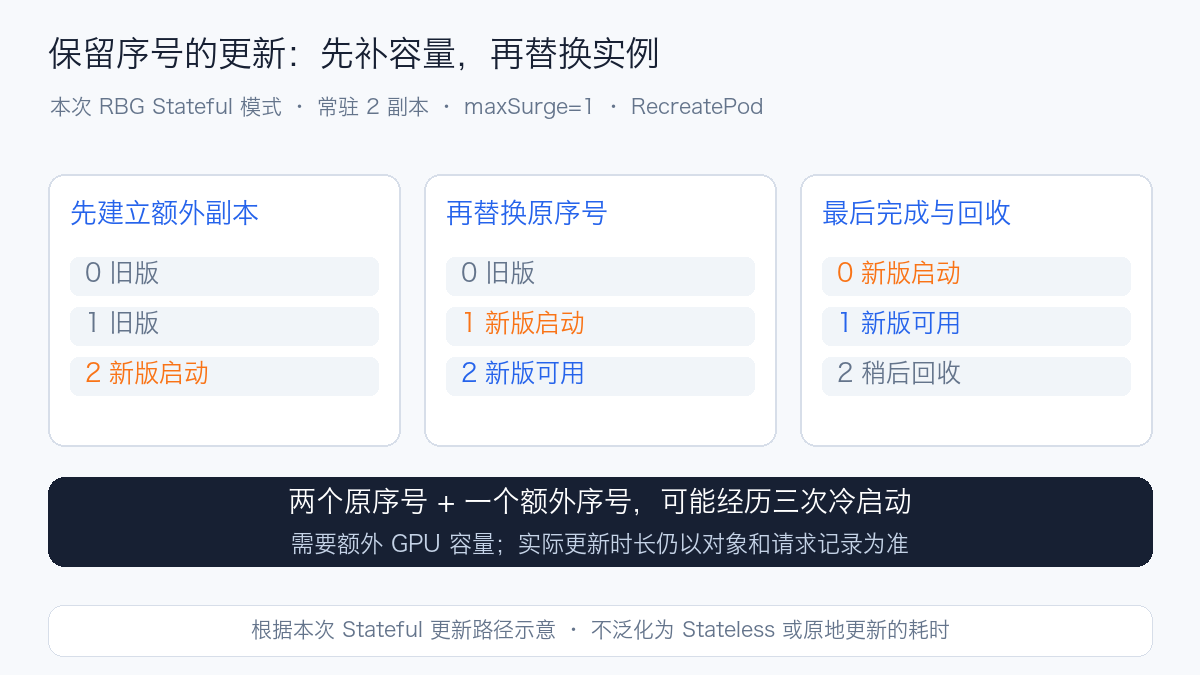
This experiment's Stateful mode preserves the original ordinals 0 and 1. During an update, an additional replica with ordinal 2 is created first; once it becomes available, instances on the old ordinals are replaced in sequence, and the extra replica is finally reclaimed. Updating two resident replicas may involve a total of three cold starts: the extra replica plus the two original ordinal replicas. This is the actual behavior under this mode, version, and strategy, and is not generalized to all RBG update methods. Stateful reconciliation implementation at a pinned version
For fully stateless standalone inference replicas, whether instance ordinals need to be preserved should be decided before configuration. The update cost of Stateless mode can be further evaluated; this experiment did not run a side-by-side comparison of the two modes, so no performance conclusion can be given in advance.
4. Calibrate the Load First, Then Perform Lifecycle Operations
Initially reusing the previous article's 1.6 RPS, three phases of 96 requests each completed successfully, but each drain took about 118 seconds and TTFT P95 was about 52 seconds, indicating sustained queue buildup. These are retained as overload calibration and are not counted in the formal lifecycle results.
After recalibrating with 0.3, 0.6, and 0.9 RPS, the three no-operation baseline rounds used approximately 5K input, 128 output, at 0.6 RPS. Each round had 48 requests, 144/144 fully successful, with TTFT P95 of 1.718, 1.720, and 1.714 seconds respectively. This is only a stable baseline for this request shape, not a long-term commitment to production capacity.
| Scenario | Arrival and output | Operation and observation purpose |
|---|---|---|
| No-operation baseline | 0.6 RPS, ~5K / 128 tokens | Confirm client and two replicas are stable under the chosen load |
| 2→3 scale-up | 0.9 RPS, ~5K / 128 tokens | Keep pressure, observe when new capacity starts serving and how the old queue changes |
| 3→2 scale-down | Same as above | Observe in-flight request draining and queueing after capacity reduction |
| Rolling update | 0.3 RPS, ~1K / 512 tokens | Let longer streams span replica alternation, observe the full update process |
| Normal Pod deletion | Same as above | Whether the normal termination path drains; how the controller replenishes replicas |
| EngineCore SIGKILL | Same as above | Impact of abrupt inference process termination on existing streams, new arrivals, and recovery |
The 0.9 RPS for scaling is higher than the stable baseline load and is used to observe capacity changes; it does not mean two replicas have no queueing at that rate. Do not draw causal conclusions by directly comparing a single round's P95 across phases; the same arrival rate before and after scaling, actual placement, queue, and time windows must be examined together.
Normal deletion uses Pod deletion with a bandwidth limit. Process failure locates the only EngineCore process inside this experiment's model Pod and sends SIGKILL. The two are counted separately: the former goes through the termination flow, the latter gives the killed process no chance to drain. No shutdown, drain, or network fault injection was performed on shared nodes.
All operations are initiated approximately 45 seconds after traffic starts. The formal window must cover the action, cold start, recovery, and at least 30 seconds of new request arrivals after recovery; merely letting already-issued requests drain after recovery does not count as sufficient post-recovery samples. Shorter pilot windows are labeled separately and are not mixed into full repeated experiments.
Prompt and Full-Stream Criteria
Actual requests use /v1/completions, with the Prompt structure:
English rendering — the original text is retained below.
Set temperature=0, ignore_eos=true, stream=true, stream_options.include_usage=true; each request records actual input, output usage, and Prompt SHA256. Fixed-length synthetic completion loads are used here to control inference workload; this is not packaged as a real user Q&A quality evaluation.
HTTP 200, content appearing, receiving [DONE], and output in usage exactly equal to the target length — all four conditions must be met for success. No automatic retries; a truncated stream after HTTP 200 is still counted as failure. The client's maximum in-flight is 64; planned arrivals that could not be issued are recorded as not_sent and remain in the success-rate denominator.
TTFT is measured from client POST to first content; TPOT is (最后内容时间-首段内容时间)/(输出 token 数-1) per request. This is the distribution of per-request average TPOT, not per-token ITL. Failed requests are listed separately; do not show only successful request latency while hiding timeouts and stream interruptions.
5. Using Grafana to Explain the Process
Two dedicated dashboards show request quality and resource causes respectively, with unified 5-second scraping, fixed phase time windows, and light-themed landscape screenshots.
| Layer | Metric | How to read |
|---|---|---|
| Client | rbg_study_requests_total, TTFT / TPOT / E2E histograms |
Look at full-stream success, errors, unissued requests, and latency; these are this experiment's client metrics |
| Kubernetes | rbg_study_model_pods, rbg_study_desired_replicas |
From a read-only object observer; shows desired, Ready, and Terminating respectively |
| Engine | vllm:num_requests_running, vllm:num_requests_waiting |
Distinguishes currently executing from queueing in the engine; meaning differs from client in-flight count |
| GPU | DCGM GPU_UTIL, FB_USED | Only devices belonging to this experiment's model Pods; FB_USED converted from MiB to bytes |
| RBG controller | controller_runtime_reconcile_total, controller_runtime_reconcile_errors_total |
Native reconciliation and errors; cannot substitute for request availability |
For example, the client success count's one-minute rate and TTFT curve can be written as:
sum by (result) (rate(rbg_study_requests_total{phase=~"$phase"}[1m]))

histogram_quantile(
  0.95,
  sum by (le) (rate(rbg_study_ttft_seconds_bucket{phase=~"$phase"}[1m]))
)
Grafana's one-minute sliding P95 is a histogram estimate and is updated when requests complete. With the longer requests in this experiment, the curve lags relative to request start; full-round P95 and failure-window analysis are computed precisely from per-request records. Empty series display as no data; do not interpret the absence of scraped metrics as zero.
The controller's HTTPS metrics also require authentication handling: the Prometheus ServiceAccount has /metrics read permission, and the controller has TokenReview / SubjectAccessReview delegation permissions. This experiment configured a self-signed certificate exception for the dedicated scrape endpoint; production should configure a trusted CA to avoid spreading verification bypass to other endpoints.
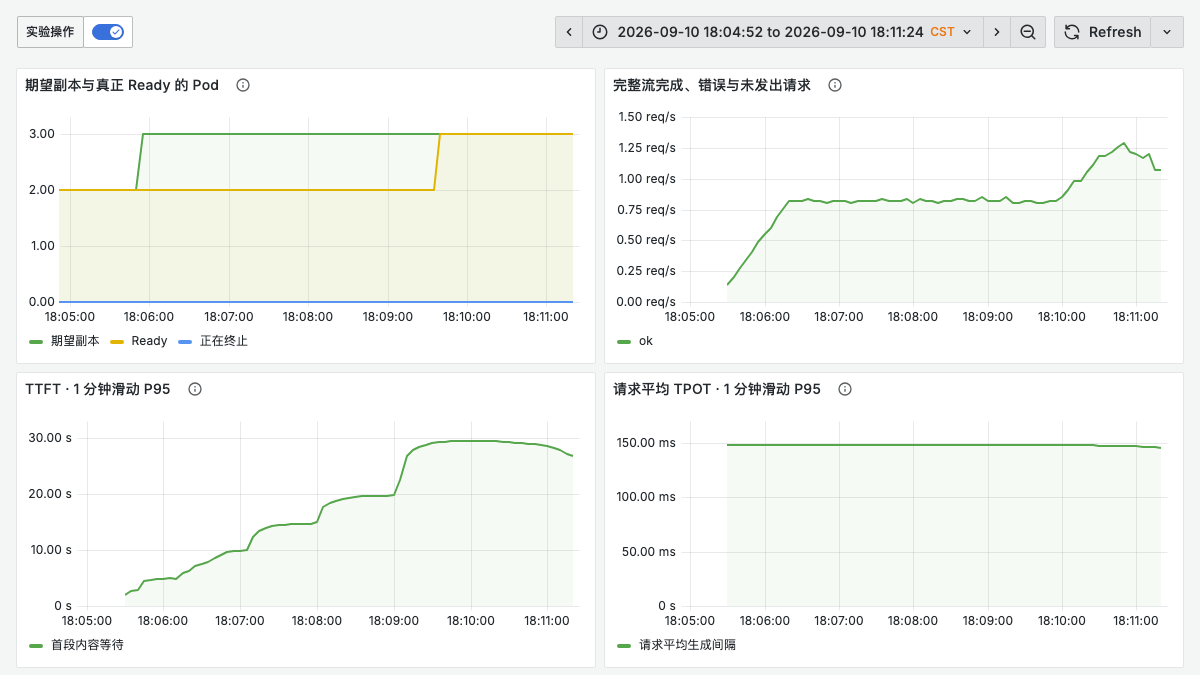
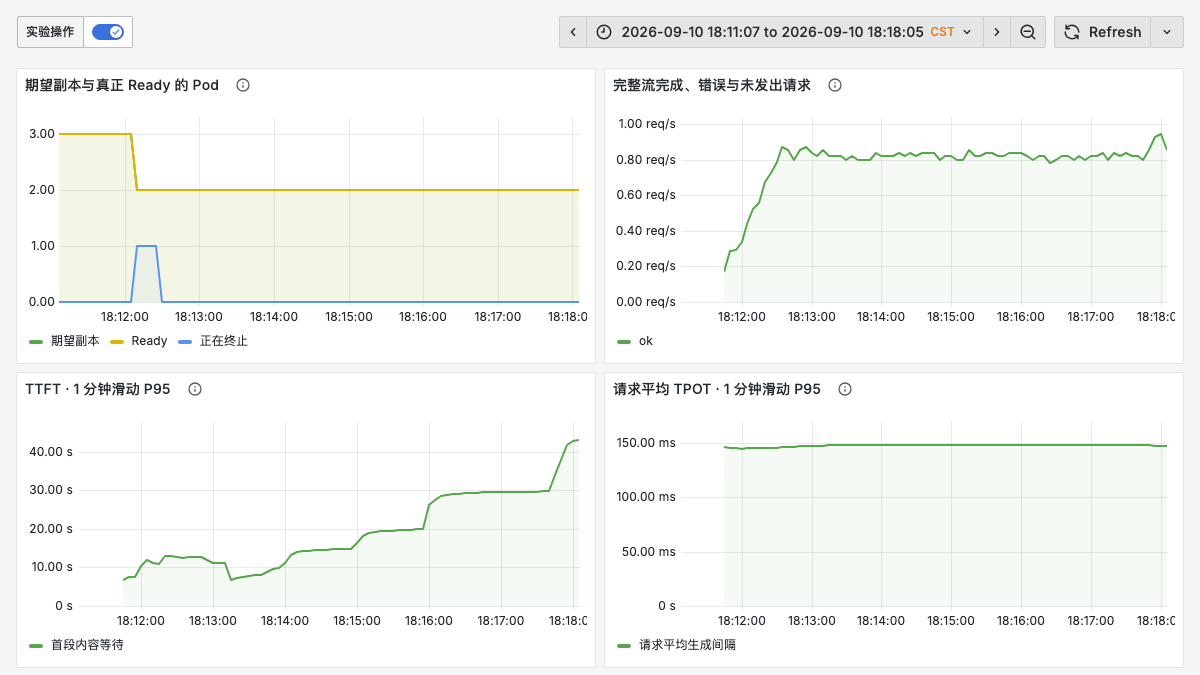
The client dashboard for the first scale-up round places desired replicas, Ready Pods, complete requests, and one-minute sliding latency in the same time window. Desired replicas first change from 2 to 3; before the new replica is Ready, TTFT has already risen with queueing. After Ready reaches 3, the sliding P95 still lags; the Ready instant cannot be treated as the experience recovery time.
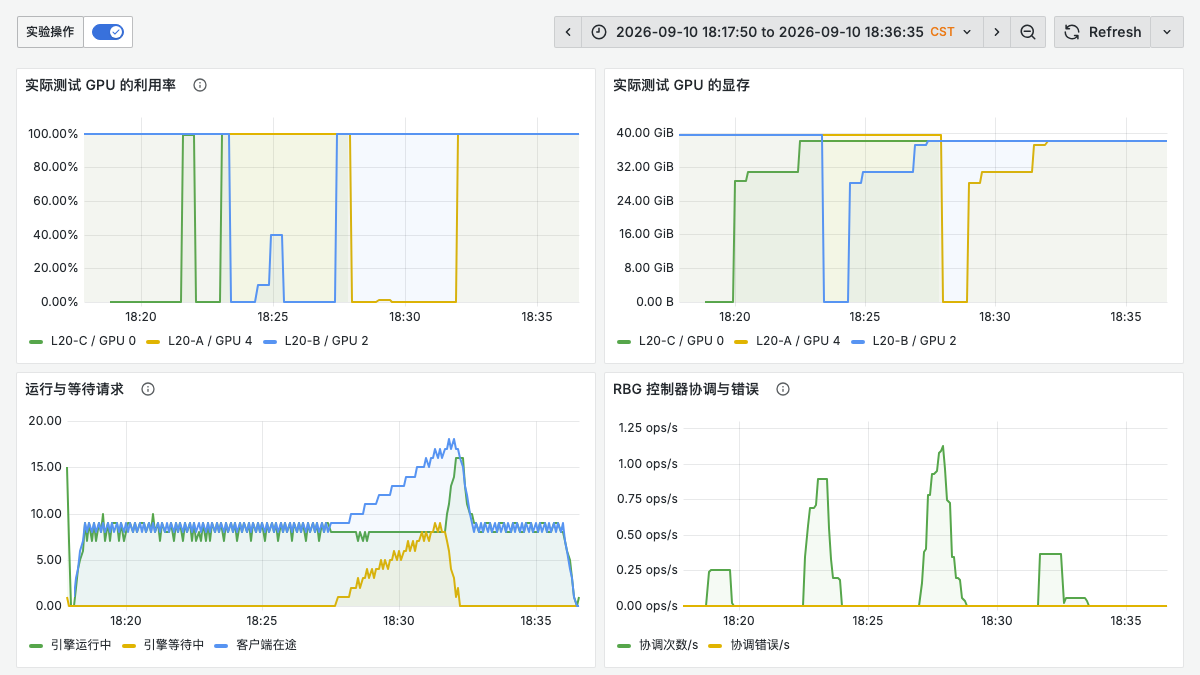
The resource dashboard for the same time window shows the new device transitioning from idle to occupied, GPU memory rising with model loading, and GPU utilization entering high load. Here L20-A/B/C are anonymized device identifiers; client in-flight and engine waiting coexist, so a single card reaching 100% does not prove the entry point has fully utilized the new replica.
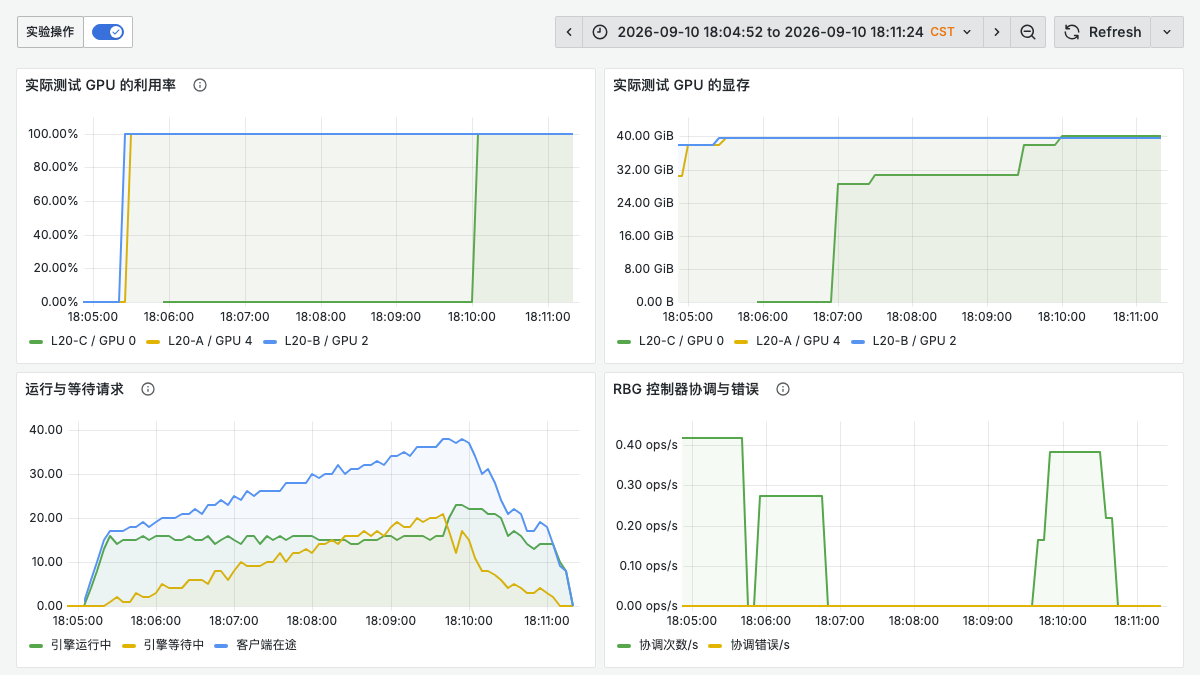
In the first scale-down round, desired and Ready return from 3 to 2, with a brief Terminating Pod; the complete-return rate does not drop off a cliff, but sliding TTFT continues to rise. Here, per-request placement and completion records must be examined together; do not claim scale-down has no performance impact based solely on the success rate.
6. Full Results and Reliability Boundaries
Across 18 phases, a total of 3,735 requests were issued, of which 3,720 completed fully successfully, 15 failed, and none were unissued. All failures occurred in the three phases with deliberate EngineCore termination. Baseline, scale-up, scale-down, rolling update, and normal deletion phases all returned every planned request in full; this does not mean all requests met latency SLOs.
The following percentiles are computed independently per round of successful requests, not merged across three rounds; failures and unissued requests are listed separately.
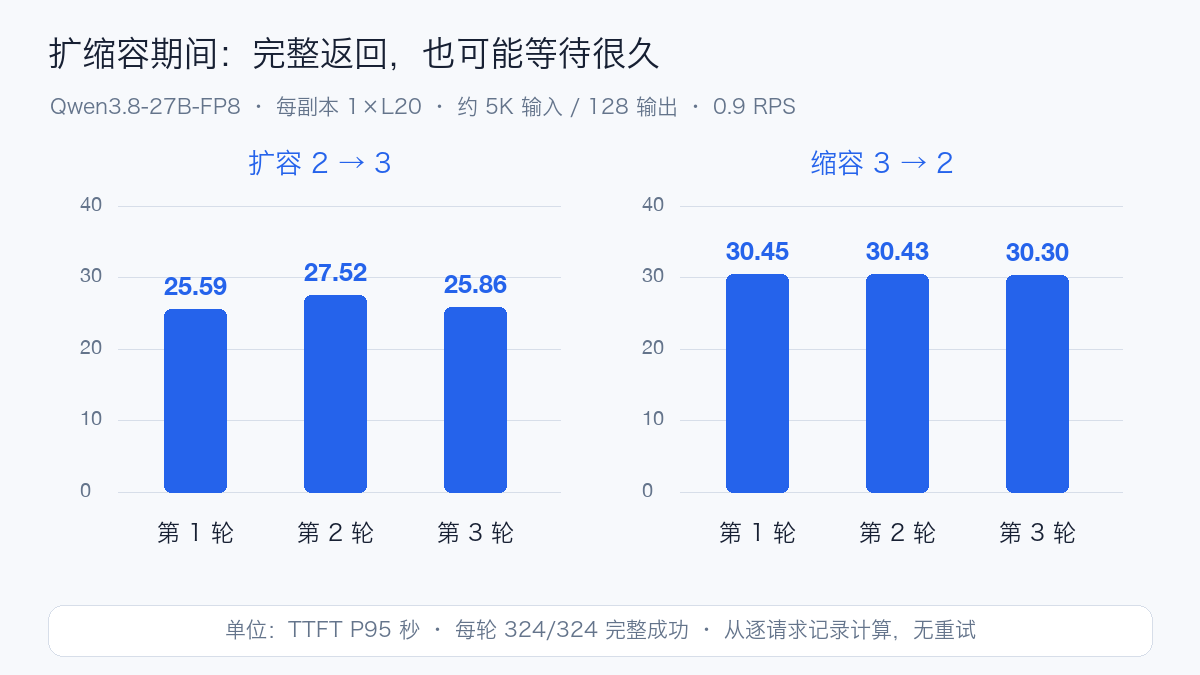
The full-round TTFT P95 summary for the three scaling rounds is as follows. Its granularity differs from Grafana's one-minute sliding P95 above: the former is computed from per-request records, while the latter is used to observe when changes occur.
| Scenario / Round | Arrival RPS | Full Success / Planned | Failed / Not Sent | TTFT P95 s | TPOT P95 ms | E2E P95 s |
|---|---|---|---|---|---|---|
| baseline / 1 | 0.6 | 48 / 48 | 0 / 0 | 1.718 | 90.559 | 13.204 |
| baseline / 2 | 0.6 | 48 / 48 | 0 / 0 | 1.720 | 90.673 | 13.220 |
| baseline / 3 | 0.6 | 48 / 48 | 0 / 0 | 1.714 | 90.686 | 13.219 |
| scale-up / 1 | 0.9 | 324 / 324 | 0 / 0 | 25.587 | 141.191 | 42.916 |
| scale-down / 1 | 0.9 | 324 / 324 | 0 / 0 | 30.451 | 141.205 | 46.525 |
| rollout / 1 | 0.3 | 324 / 324 | 0 / 0 | 25.108 | 58.326 | 54.911 |
| delete-graceful / 1 | 0.3 | 135 / 135 | 0 / 0 | 31.840 | 58.338 | 60.922 |
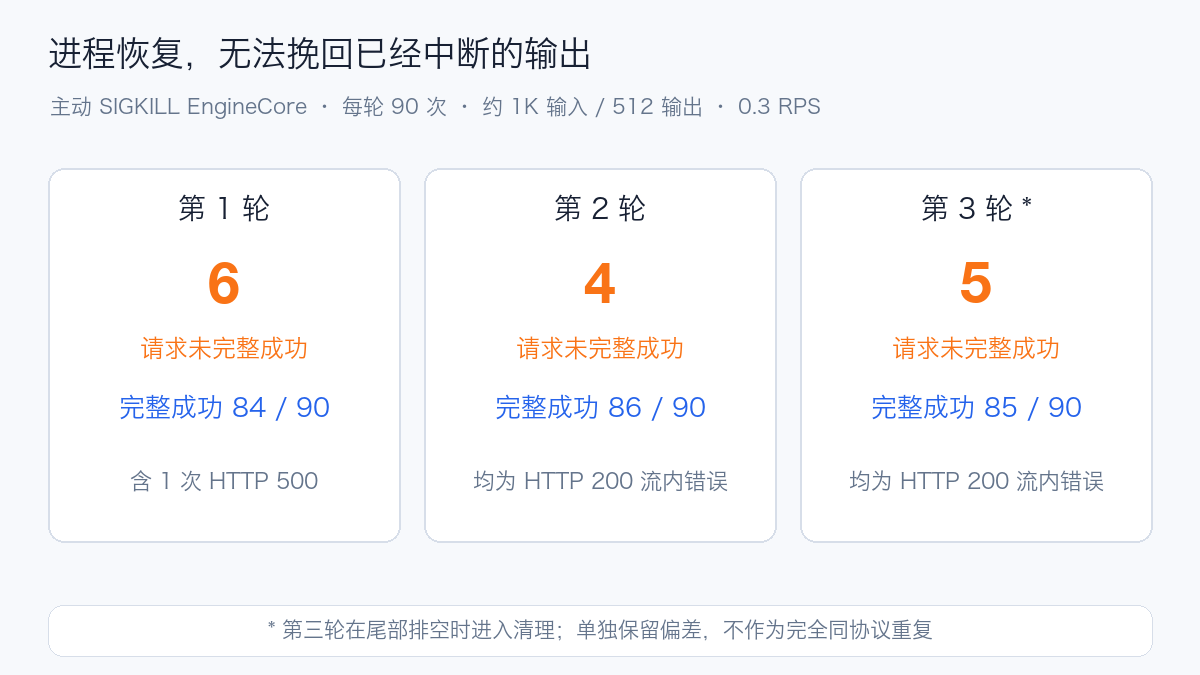
| kill-engine / 1 | 0.3 | 84 / 90 | 6 / 0 | 7.336 | 58.317 | 36.380 |
| scale-up / 2 | 0.9 | 324 / 324 | 0 / 0 | 27.520 | 141.272 | 45.320 |
| scale-down / 2 | 0.9 | 324 / 324 | 0 / 0 | 30.429 | 141.251 | 46.540 |
| rollout / 2 | 0.3 | 324 / 324 | 0 / 0 | 28.750 | 58.383 | 58.583 |
| delete-graceful / 2 | 0.3 | 135 / 135 | 0 / 0 | 32.220 | 58.379 | 61.946 |
| kill-engine / 2 | 0.3 | 86 / 90 | 4 / 0 | 7.520 | 58.366 | 36.986 |
| scale-up / 3 | 0.9 | 324 / 324 | 0 / 0 | 25.856 | 141.191 | 43.756 |
| scale-down / 3 | 0.9 | 324 / 324 | 0 / 0 | 30.298 | 141.310 | 47.037 |
| rollout / 3 | 0.3 | 324 / 324 | 0 / 0 | 25.160 | 58.348 | 54.979 |
| delete-graceful / 3 | 0.3 | 135 / 135 | 0 / 0 | 32.620 | 58.421 | 62.233 |
| kill-engine / 3 | 0.3 | 85 / 90 | 5 / 0 | 7.564 | 58.408 | 37.075 |
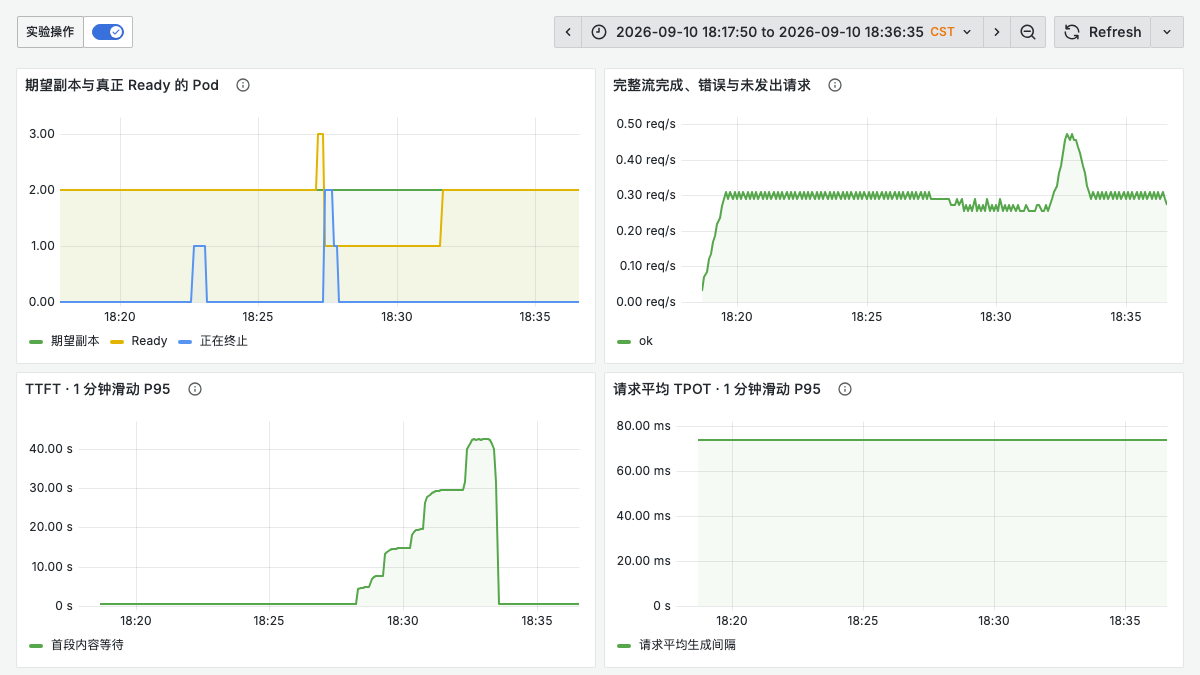
In the first round of the rolling update, the desired replica count stayed at 2, but Ready briefly dipped, and the client-side sliding TTFT rose with queueing; the resource dashboard simultaneously recorded old device release, new device loading, and engine waiting. The full request curve is consistent with the single-round 324/324 result, but this cannot be used to interpret the Ready fluctuation as meaning there was no user waiting at all.
The five failed streams in the forced-termination phase of the first round had already received content and [DONE], but the SSE contained EngineCore's InternalServerError and no final usage; all 14 HTTP 200 failed streams across the three rounds matched this pattern. This shows that counting only HTTP 200, or even checking only [DONE], would miss this failure. Another HTTP 500 returned an entry-side HTTPRoute-not-found error, which still needs to be located using entry controller and route object evidence and cannot be attributed directly to RBG. The original errors and partial outputs were preserved and were not overwritten by retries.
The second and third rolling-update rounds also captured a scene of object identity inconsistency: the owner UID of the same-named old Pod differed from the UID of the new RoleInstance, but the new RoleInstance reported Ready for a time. The two rounds recorded 18 and 19 sampling points in this state respectively; these are duplicate samples and do not represent 18 or 19 independent failures. This evidence is consistent with the local reproduction of the state computation path: when reading a Pod by name, the owner UID must also be validated, and Pods that are being deleted must be excluded. The regression tests for the local patch have passed, but it has not yet been validated in a cluster deployment, so it cannot be called a completed production fix.
In one early round of normal deletion, new request arrivals stopped less than 30 seconds after recovery, so the raw data was retained but excluded from the formal summary, and a separate supplementary test was run after extending the arrival window. The device codes and dashboard scope in the figures have been anonymized; the data used in the summary figure contains only per-round statistics, not raw requests, cluster objects, or node information.
The following boundaries are retained when interpreting the final data:
- This is the combined behavior of RBG + fixed AIBrix entry + vLLM. There is no Deployment control under the same conditions, and no claim is made that RBG is faster or more reliable than Deployment.
- Manually changing the ScalingAdapter replica count to validate the execution path is not equivalent to validating HPA, Planner metric decisions, cooldown periods, or autoscaling policies.
- Single-GPU standalone replicas are suitable for exposing cold start, draining, and stream interruption, but cannot represent P/D separation, cross-node tensor parallelism, RDMA, or multi-role coordinated updates.
- The FP8 KV runtime logs suggest an uncalibrated default scaling, and some FP8 kernels on the L20 use default configuration. These require additional accuracy and performance evaluation; this document does not claim lossless precision or hardware limits based on them.
- Three repeated rounds, a small number of fixed nodes, and synthetic arrivals are not sufficient to represent all production distributions. Shared nodes, specific GPUs, host and storage contention can all affect timing.
maxUnavailable=0is an update budget, not a guarantee of zero interruption for existing streams. Process hard failures, gateway traffic-draining propagation, and drain timeouts still need to be verified by per-request evidence.
Execution deviation in the final round
During the third-round EngineCore failure, the local supervisor's DNS resolution to the cluster failed, and automatic acceptance and first evidence return were not completed. The in-cluster client independently ran all 90 requests: 85 full successes and 5 in-stream errors. The original streams and object snapshots were then retrieved from the node-persisted result directory. Independent 5-second Pod sampling recorded three consecutive dual-replica Ready states after the container restart, followed by a new arrival window of about 152 seconds, and all 46 post-recovery arrival requests returned completely.
Cleanup occurred after the last planned arrival but before the tail requests finished. Therefore this round also includes tail traffic draining and cannot be treated as a repeat with exactly the same protocol as the previous two rounds. The table above retains the full denominator and explicitly records this deviation; it is not used alone to prove lossless failure recovery, and the local DNS failure is not interpreted as an RBG controller failure. The final confirmation showed zero model Pods, and the archived raw evidence was returned locally with SHA256 computed.
7. From experiment to production configuration
First, set startupProbe and the update window according to real startup time. Reading weights usually completes only part of the work; compilation, GPU memory planning, and CUDA Graph also need to be covered. The readiness probe should also reflect whether the inference engine can actually accept new requests.
Then treat the exit path as an interface contract. Entry stop-selection, probe changes, preStop, engine shutdown timeout, and Pod grace period must be checked together. The grace period should cover traffic-draining propagation and long requests allowed to complete, with sufficient margin; the 10 / 90 / 180 seconds used here are only experimental parameters, not general recommendations. Upper-layer requests with business side effects must not be masked by unlimited automatic retries.
The capacity budget must include extra replicas. If all GPUs are normally occupied, yet maxUnavailable=0 and maxSurge=1 are required, new replicas may have no place to start. Combine node fragmentation, affinity, queue quotas, and the longest cold-start preparation margin, and decide when to scale based on the qualified request rate rather than GPU utilization alone.
Finally, make clear where "state" lives. In this experiment, the Pod-level compilation cache disappeared with Pod recreation, but a container process restart can reuse the same Pod's emptyDir; so the recovery paths for Pod deletion and EngineCore failure are inherently different. Production can evaluate persistent compilation caches and prewarming, but model version, engine version, CUDA version, and hardware architecture must be isolated; startup times from different cache states cannot be fairly compared directly.